Explore your warehouse
Browse schemas, tables, views and columns, and preview real rows, without writing any SQL.
The Explorer shows what is actually in your warehouse, read live from its own catalogue: these schemas, these tables and views, these columns, these rows. Other pages show a reading of the warehouse (the semantic map shows the tables someone put on it, the capacity card shows a byte count). The Explorer is the one that answers "what is in there?" the way a database console does.
It is read-only. Nothing you do here changes your data. Changes are made in Modelling or the SQL shell, and the Explorer links to both.
Open the Explorer
Go to Data · Explorer. You can also press Explore in the header of the Warehouse page, or Explore on a warehouse's card to open that warehouse's tree. Every member of the workspace can use it.
Read the tree
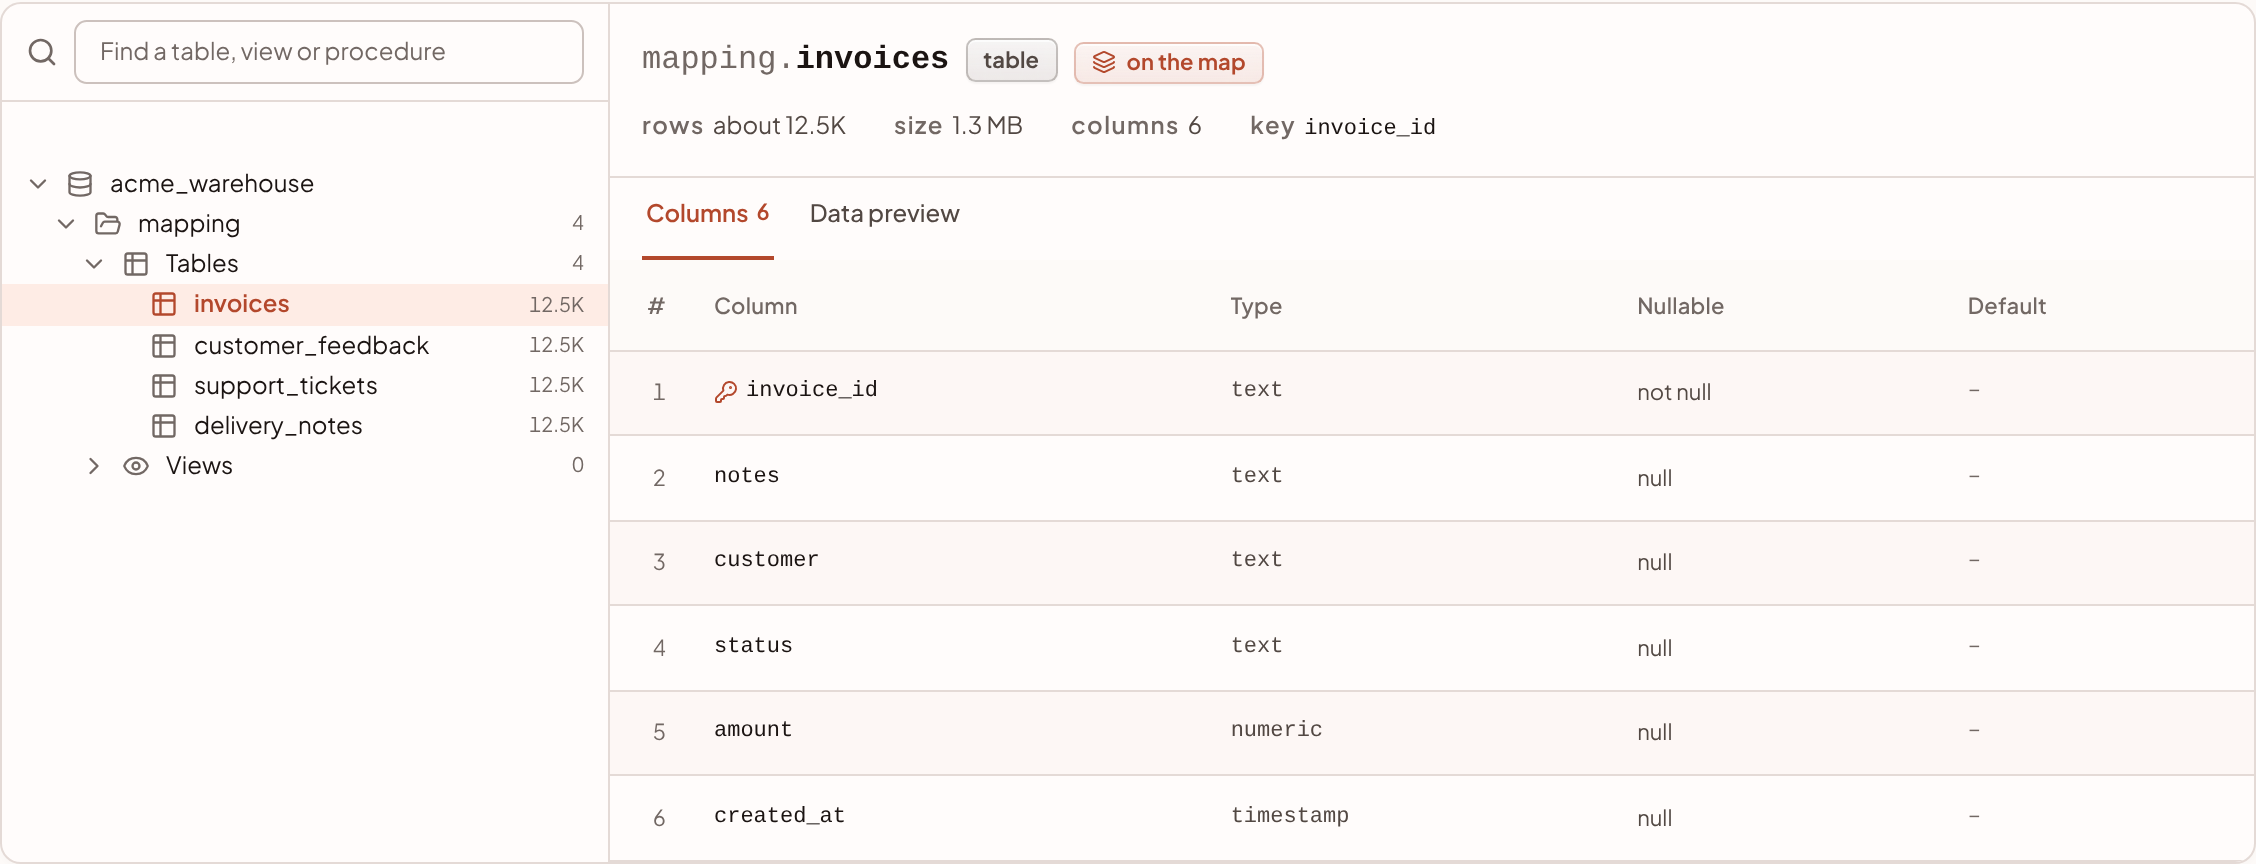
The tree on the left has four levels: the warehouse (the database), a schema, a folder, then the object.
- Warehouses. Every warehouse in your workspace is a root in the same tree, your own first and the sanda sample dataset last, tagged sample. A warehouse that is not
healthyshows its status instead. - Schemas.
raw,derived,mapping,searchandmeta, each with the number of objects in it. See sanda warehouse for what each one holds. - Folders. Tables, Views, Materialized views and Procedures. Every schema shows Tables and Views.
derivedalways shows all four, because it is the one you build in. Other schemas show Materialized views and Procedures only when they hold something. - Objects. Tables and materialized views show an approximate row count on the right, so you can see where the data is without opening anything. A small ! means the object's last build failed. A layers icon means the object is on the semantic fluid.
Use the search box, Find a table, view or procedure, to filter by name. Search opens every branch that matches, but it only searches warehouses whose tree you have already opened, so open a warehouse first.
The warehouse summary
Select a warehouse to see its summary:
| Fact | What it tells you |
|---|---|
| Storage | The size of the whole database, and when it was last measured. |
| Tables | How many tables there are across every schema. |
| Views | How many views and materialized views there are. |
| On the map | How many relations the semantic fluid may query. |
Below the facts, a table lists each schema with its number of tables, views, materialized views and procedures, its estimated rows and its size. Row counts are the database's own estimates, and sizes include indexes. A table nobody has counted yet shows no count in the tree, and not counted yet in its header.
The summary also says how much of derived you have modelled, and links to Modelling and SQL shell.
Inspect a table or view
Select an object to open it. The header shows its kind, and, where they apply:
- its version, for anything sanda defined in
derived; - last build failed, if a materialized view's most recent build did not finish;
- on the map, with a link to the semantic fluid, and the name it has there;
- not readable by sanda, if the modelling login cannot select from it, which can happen to a table created some other way. Its columns are still listed.
Under that, a line of facts: rows (about 12.5K), size, number of columns, the primary key, and what a view reads. A view holds no rows of its own, so it shows as many as it reads. A materialized view shows when it was last built and how long the build took.
Columns
The Columns tab lists each column in the table's own order: its position, name, type, whether it allows nulls, and its default. A key icon marks a primary key column, because the key is the grain of the table. A lock marks a column whose values the preview will not show (see below).
Data preview
The Data preview tab reads the first rows of the table when you open it, and again when you press Refresh. A preview shows:
- up to 50 rows and the first 60 columns (the Columns tab lists the rest);
- no particular order. The preview asks for rows without sorting so that a huge table answers at once, so it is a look at the shape of the data, not a report;
- long values cut at 300 characters.
A preview is a real query on your warehouse, run inside a read-only transaction. It happens when you open the tab, not when you click a table to read its columns.
Definition
For a view, a materialized view or a procedure, the Definition tab shows the SQL it is, and what it reads. A view runs its statement over what it reads each time it is asked. A materialized view holds the rows its statement produced when it was last built.
History
Anything sanda defined in derived has a History tab, with the same content as in Modelling:
- Runs: each build or call, when it ran, what started it, the outcome, how long it ran, what it was billed as, and the rows and size afterwards.
- Definitions: every version, what changed and who asked, with the statement sanda ran.
- Activity: the audit records for the object.
An object in derived that was made some other way, for example by a table created in the SQL shell, is listed but has no history. The pane says Made outside sanda, and sanda will not drop it for you.
What the Explorer hides
Two kinds of column are counted but never listed or fetched:
- Bookkeeping columns. The managed sync and the CSV loader add columns of their own to landing tables, whose names start with an underscore and a reserved prefix. The Explorer leaves them out everywhere, and the header says how many were not shown, for example 2 of the loader's own not shown. See SQL reference for what they hold.
- Columns whose names look like secrets. A name with a word like
password,token,secretorapi_keyin it is listed with a lock, and its values are withheld from previews. The Data preview tab says how many columns were withheld.
The Explorer also does not list the managed sync's own working area, which is not yours to read.
Row counts are estimates
The number next to each object, and on the summary, comes from the database's statistics, not from counting the rows. It is quick, and it can be a little behind after a large sync. If you need an exact figure, run select count(*) in the SQL shell.
Where to make changes
| To do this | Go to |
|---|---|
| Draw, write or redefine a view, or schedule a rebuild | Modelling |
| Run your own statement, read-only or read-write | sanda sql |
| See or change storage and compute limits | The Warehouse page: Capacity and limits takes you there |
| Put a table on the semantic fluid | The semantic fluid |
Something unclear or out of date? Tell us, and we will fix the page.