Tables and datasets
Put tables from your warehouse on the map, choose their columns, set fact or dimension, group them into datasets and take them off again.
A table on the map is one table from your warehouse, plus what sanda knows about it: a name, whether it is a fact or a dimension, the grain of a row, its key, its event time, its columns and the dataset it belongs to. Everything else in the fluid hangs off a table. A metric is measured on one, a dimension reads a column of one, and a relationship joins two.
Two words are easy to confuse. A table is one table in your warehouse. A dataset is a group of tables that you define, such as "the Xero data".
Add tables from your warehouse
-
Open the picker. On the Semantic fluid page, press new table on the rail. In the list view, press Add tables.
The dialog, Add tables from your warehouse, lists everything that has landed, read live. Tables are grouped by the connection they came from. The filter box narrows by name or relation, and a group heading folds. Tables already on the map show on the map and cannot be ticked again.
-
Tick the tables you want. Each row shows the name sanda would give the table, a fact or dim badge, its relation, its column count and an approximate row count. Select all ticks a whole group.
Press the badge to flip a wrong guess before the table is added.
-
Choose columns if you need to. Press a table's name to open its columns. See choose the columns.
-
Pick a dataset. Under Group into, keep "its connector's dataset", or pick another.
-
Press Add N tables. You can add up to 60 tables at once.
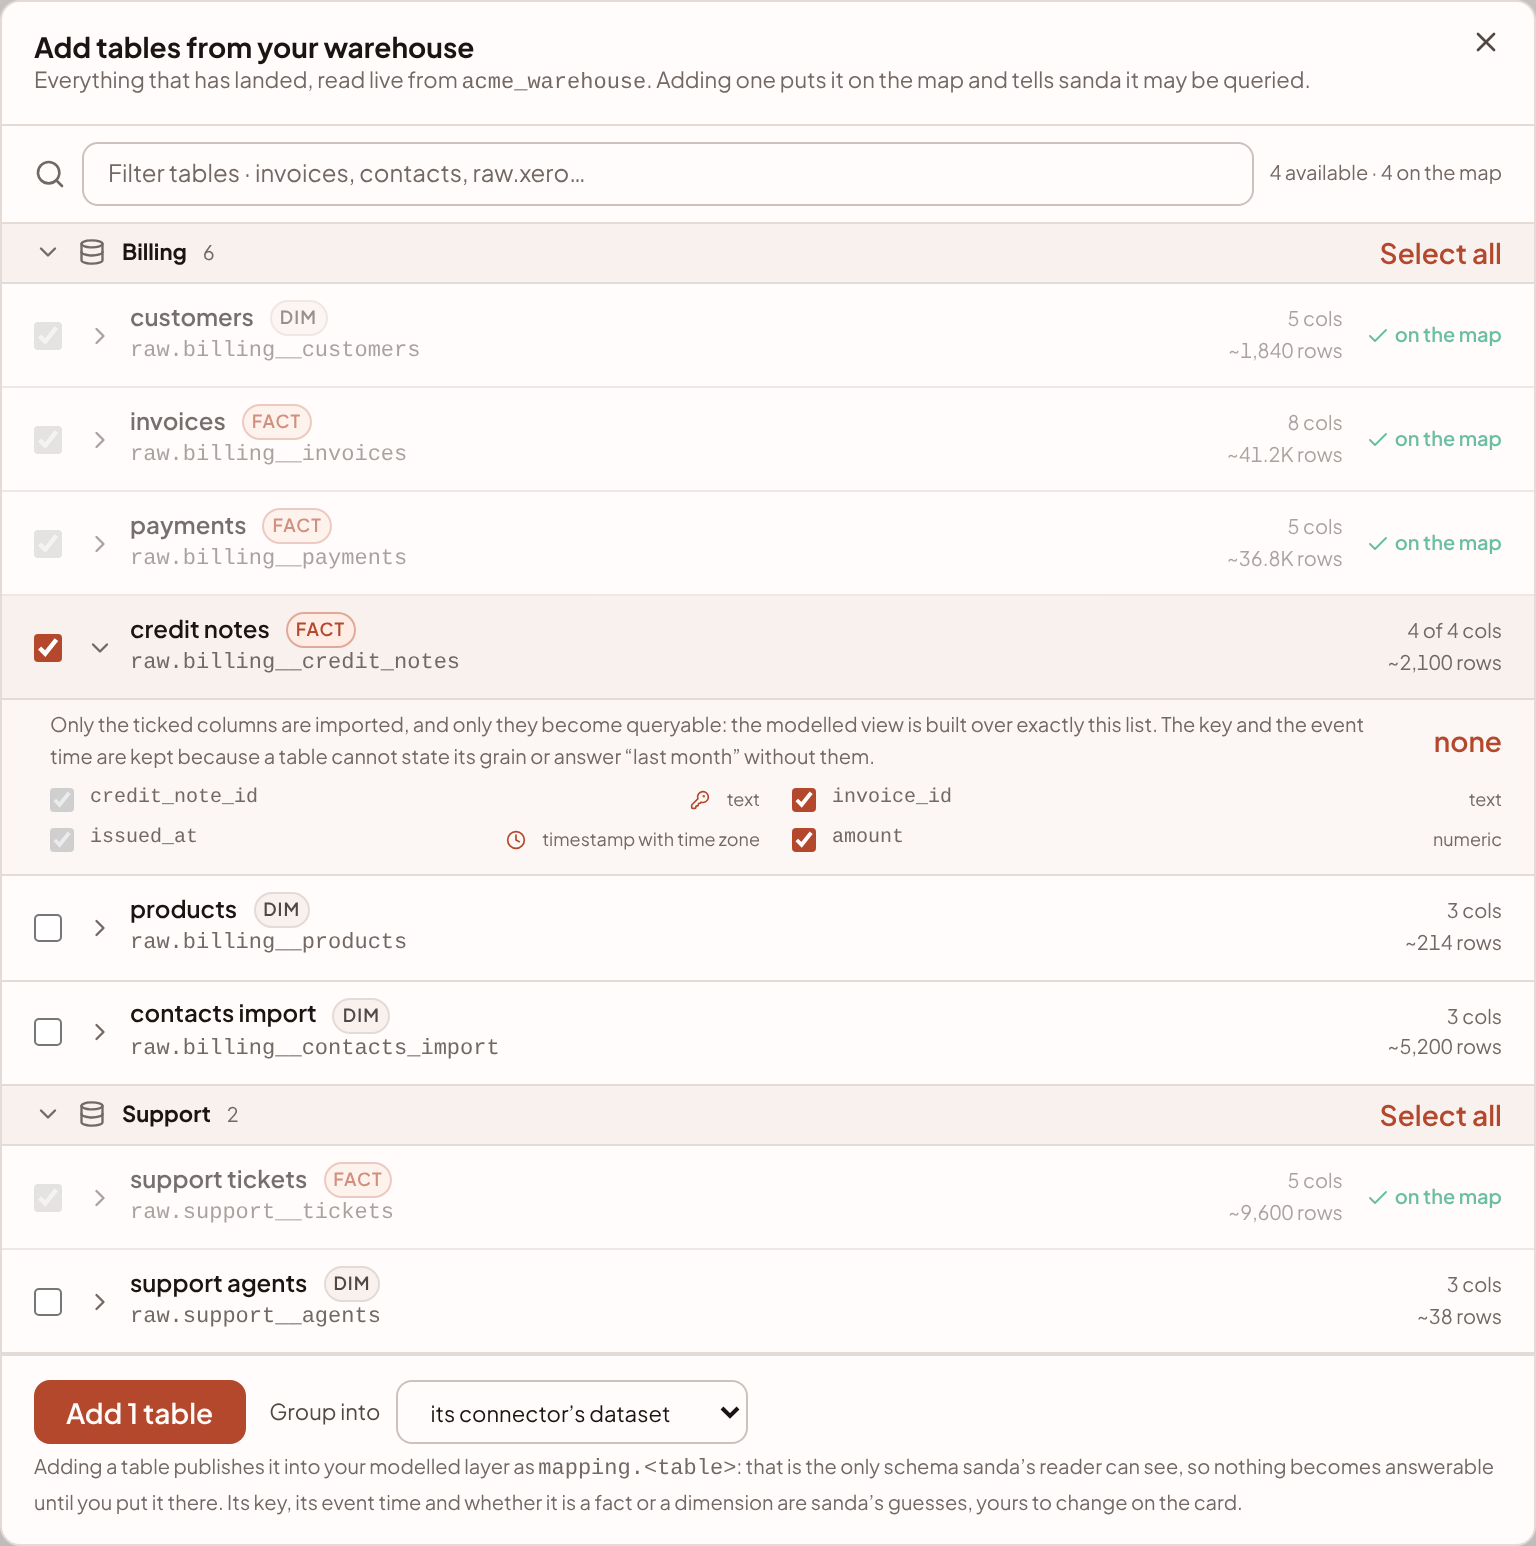
Added tables are live at once. They are not suggestions. sanda publishes each one as a view named mapping.<table> over the columns you chose, gives it a card on the map, and files it into its dataset.
Adding a table also looks for the joins its column names state, such as customer_id on an invoice and customer_id as the key of your customers. From this picker those are proposed, not created: they wait in the review queue. When cherry adds tables for you, it draws those joins straight away as part of the change you confirm, and lists them in its reply.
Only tables that have landed can be added. If the list is empty, it says "Nothing has landed yet. Once a connection completes its first sync, or a CSV is loaded, its tables show up here." See connections.
If sanda cannot publish a table, the dialog says so after adding it: the table is on the map, but answers over it fail until it can be published. Open the picker and add it again to repair it. A table flagged needs publishing is in this state.
What sanda guesses
Every table starts with mechanical first guesses, and all of them are yours to change.
| Property | The guess |
|---|---|
| Name | The connection's stream name, lowercased, with underscores and hyphens turned into spaces. A second invoices from another connection becomes invoices (shopify), then invoices 2 |
| Fact or dimension | From the name: invoices, payments and orders read as facts, and customers, products and employees as dimensions. Failing that, a table with a date and a number is a fact and anything else is a dimension |
| Key | A column named id, or after the table, such as invoice_id. sanda then counts distinct values in a sample of the rows. A column that repeats is not stored as a key, and a table whose ids are only unique together gets that pair as its key, which marks it as a bridge between two tables. A table with nothing unique gets no key |
| Event time | The first of the usual names (issued_at, occurred_at, invoice_date and so on), otherwise the first date or time column |
| Dataset | Its connection's group |
Fact or dimension
The kind decides what an agent may do with a table. A fact records something that happened and carries numbers to add up: invoices, payments, orders. A dimension records something that is and is what you slice by: customers, products, currencies. sanda aggregates facts, labels and groups by dimensions, and never sums a dimension. That rule stops an agent adding up a price list.
Change it three ways: press the fact or dim badge on the card, use This table is a in the card's menu (the dot in the header), or press the badge in the picker before adding.
Grain, key and event time
Three properties tell sanda what one row is.
- Grain is a sentence: "one row per invoice line". It is what prevents double counting, because an agent reads it before it aggregates.
- Key columns identify one row. They also decide which end of a join holds one row, and they are how sanda counts a table's rows once when a join repeats them, as when orders are counted beside their order lines. See relationships.
- Event time is the column that "last month" filters by.
Notes is a separate field: a sentence about what the table holds. The agent's full text carries it as the table's description.
To change them, open the list view, go to the tables tab and press the pencil on the table's row. The form opens with the table's current values in Table, Relation, What kind of table, One row is, Key columns, Event time column, Dataset and Notes. Change what is wrong and press Save table.
Typing the name of a table that already exists into Add table does the same: the form fills in with what is stored, says the table is already stored, and saving updates it. A field you clear is cleared. What the form has no field for, such as the row count and the column list, is kept.
Or ask cherry: "the grain of invoices is one row per invoice line". cherry changes only the fields you name.
Choose the columns
A ledger can arrive with well over a hundred columns, of which only a handful are ever reported on. Adding only those makes the card readable and the agent's context short, and it keeps the rest unreadable to any agent.
- Open the columns. Press the dot in a card's header and choose columns…. The dialog, columns on invoices, reads the table fresh from the warehouse, so columns a later sync added are offered too.
- Tick what should be readable. all and none set every box at once. The key and the event time are ticked and locked, because a table cannot state its grain or answer "last month" without them.
- Press save. The button reads save N columns, and sanda rebuilds the table's
mappingview over exactly what is ticked.
What you untick is dropped from the mapping view, not from your warehouse. An agent can no longer read it, and a metric that uses it can no longer run.
Datasets
A dataset is a group of tables. Every stream from one connection starts in that connection's group, and a table you have moved by hand stays where you put it, even when you add more tables later. A dataset gives its tables a colour on the map. The agent's full context lists which tables belong together, and glue joins two datasets.
Open the datasets panel from the rail to manage them:
- Create one. Type a name in New dataset and press add dataset. sanda gives it the first unused colour of eight: rose, peach, butter, sage, mint, sky, lilac and mauve.
- Recolour it. Press one of the colour dots on the dataset's row.
- Move a table. Use the menu on the table's row, or the Dataset list in the card's menu. No dataset takes it out of any group.
- Find your way. Hovering over a dataset dims every card outside it on the map.
- Delete it. The bin on its row deletes the group. Its tables stay on the map, ungrouped.
Tables that are in no dataset are listed under Ungrouped.
Views you build
A view or materialized view you build in Modelling reaches the map the same way a landing table does, and the picker lists it under Modelled tables. On the map it carries modelled under its name. sanda lists modelled tables first in what an agent is told, and tells the agent to prefer one when it can answer, because it is a shape you decided on rather than the shape a source arrived in.
Take a table off the map
Select the card, press Delete, and confirm with remove. sanda names the tables it is about to remove first.
Removing a table retires it. Nothing is deleted, but three things happen:
- The table leaves the map and everything an agent is told.
- Its relationships, aliases and dimensions, and the metrics measured on it, are retired with it. A metric that is not measured on the table, but builds on a retired metric with
{name}, is flagged as unresolved, and the agent is told not to use it. - Filters and categories written against it stop applying.
Add the table again from the picker and it comes back with its old name and dataset. Its metrics and relationships stay retired. Define them again and they return under their old names.
The list view's tables tab also has a bin on each row, and it retires the table in the same way, with its relationships, aliases, dimensions and metrics. A retired table stays in the list marked retired, without a bin. If you ask cherry to take a table off the map, it always asks first, even in Autonomous mode.
Wipe the fluid
At the foot of the Semantic fluid page, Wipe semantic fluid starts again from an empty map. Owners and admins can use it.
The button is not offered while the map is showing the learning dataset. Remove that from Data · Warehouse instead.
Something unclear or out of date? Tell us, and we will fix the page.