Blocks
The six kinds of block on a report canvas (kpi, bar, line, table, text and header), what each one shows, and the settings each one takes.
A block is one panel on a report canvas: a hairline border, a header you drag by, a lowercase title and a resize handle in the corner. There are six kinds. Four draw data, one holds written analysis, and one is the report's masthead.
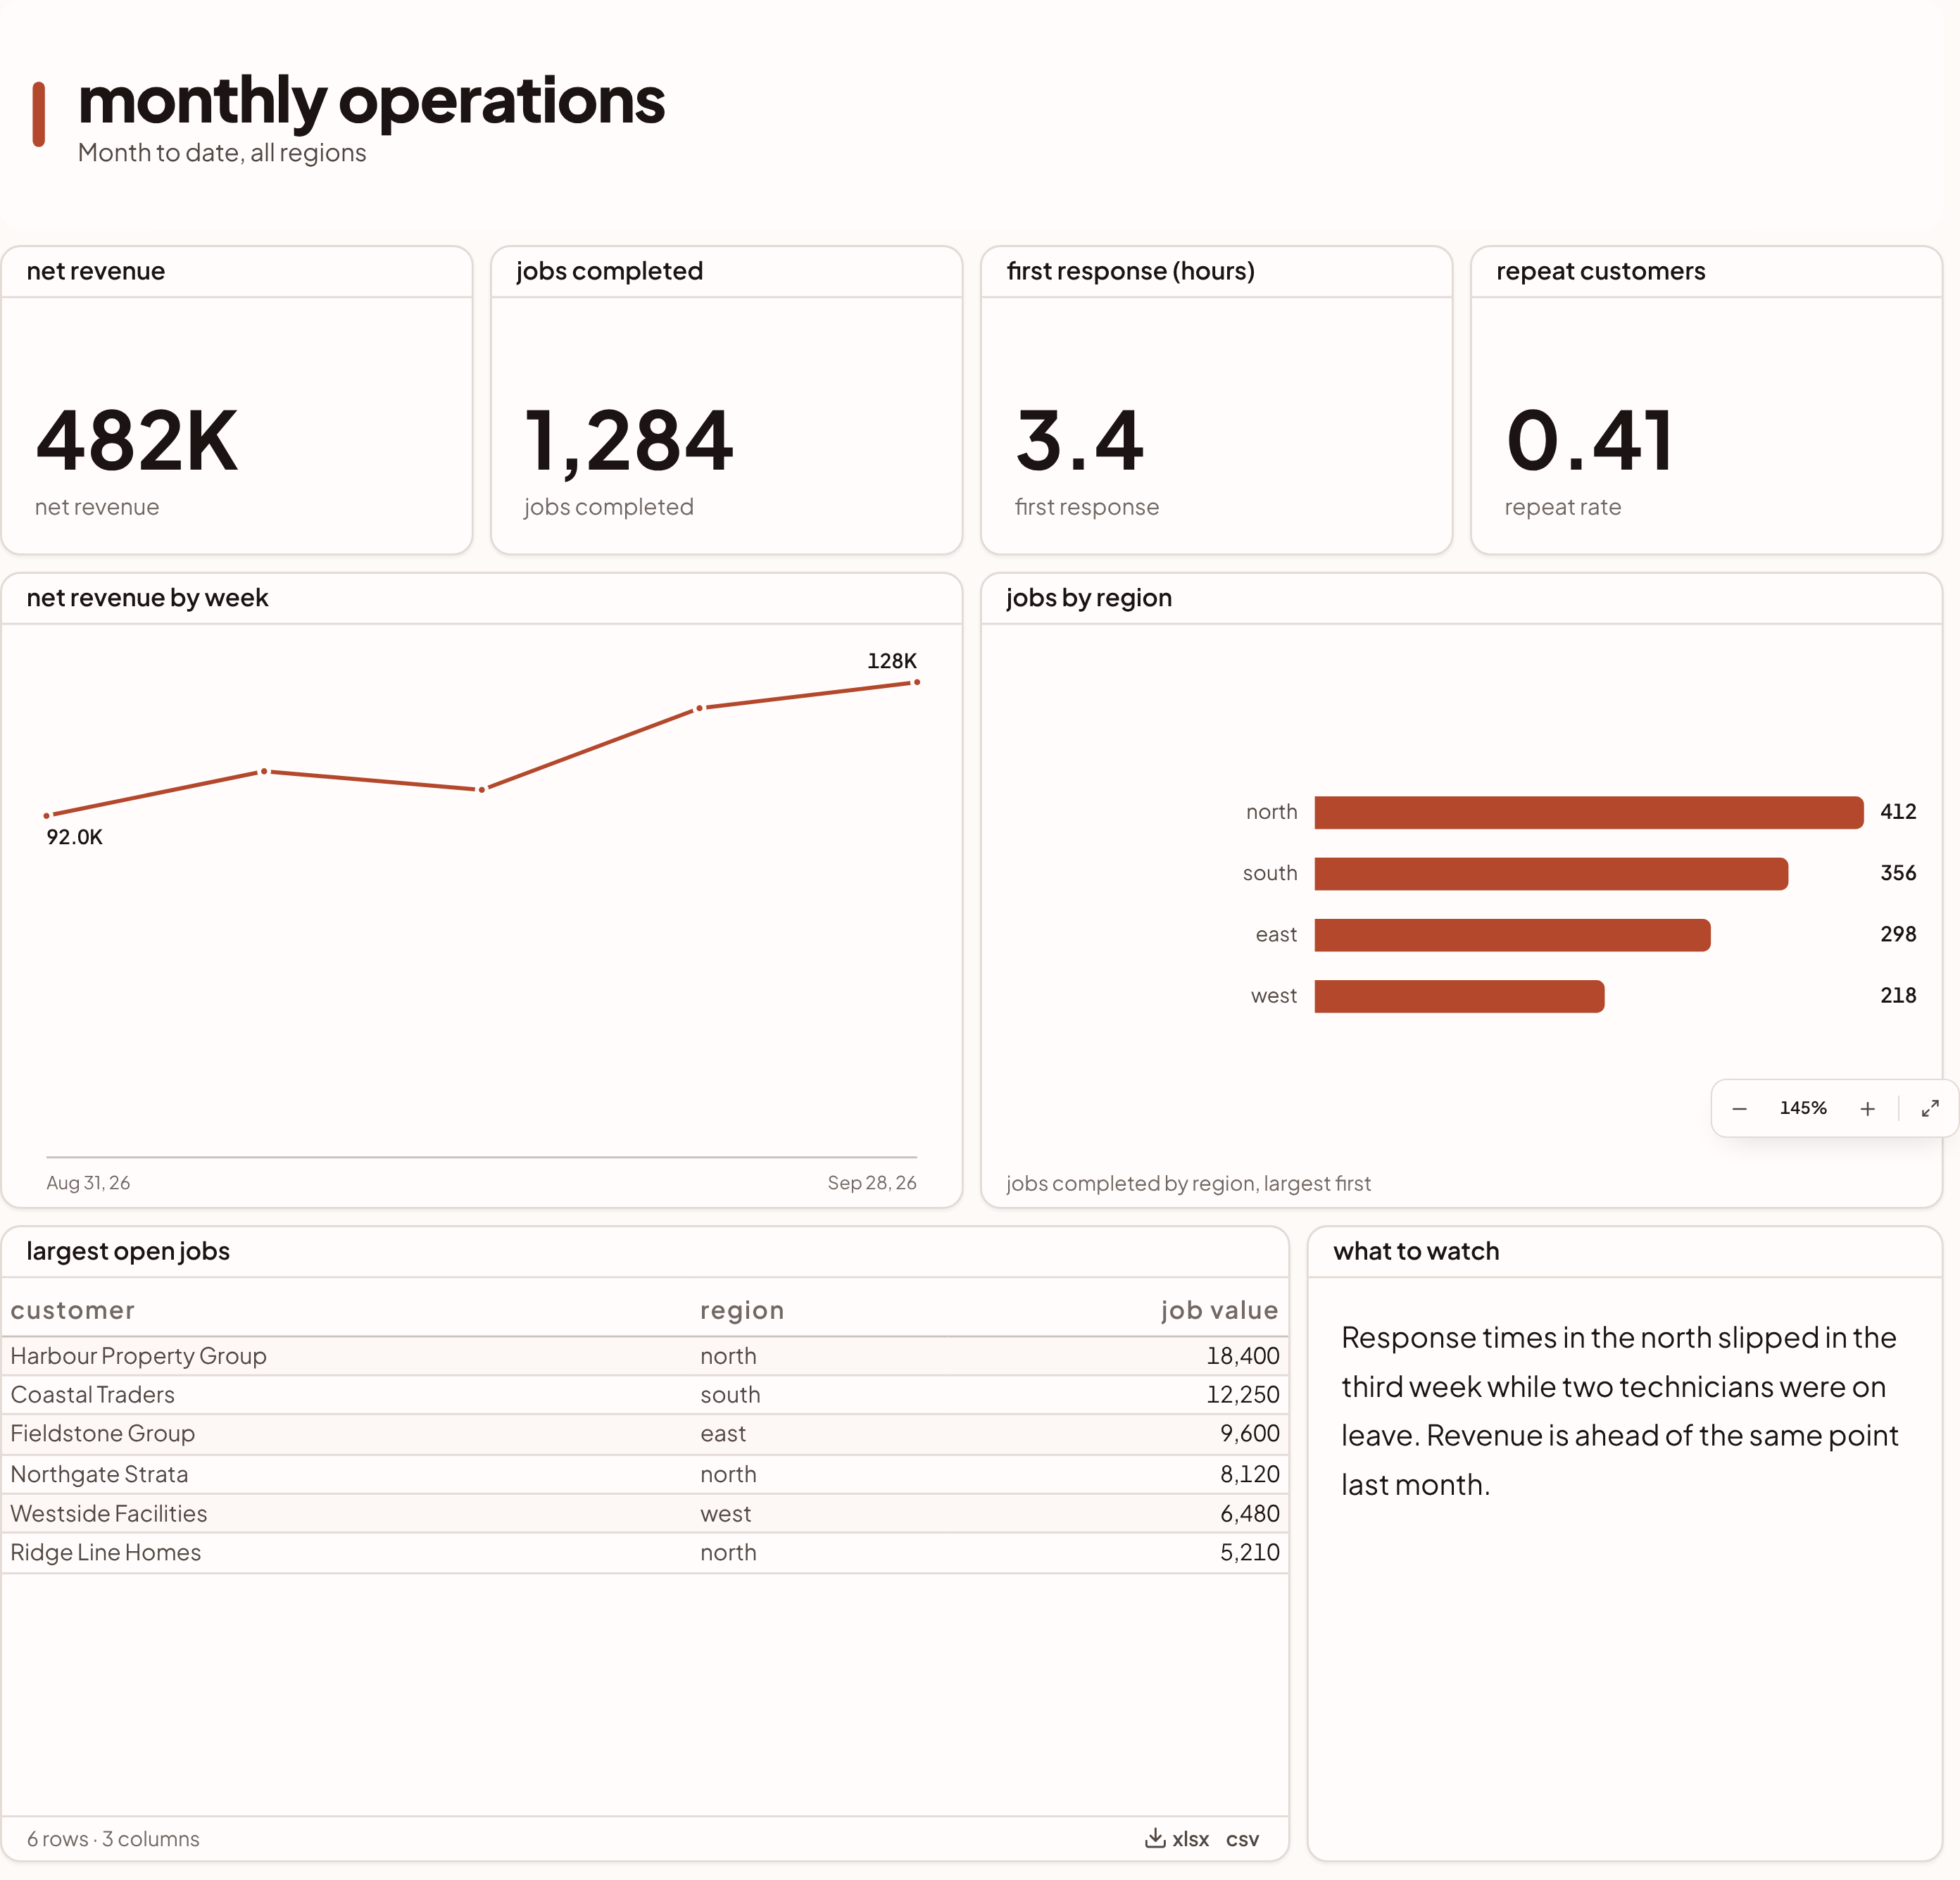
| Kind | Shows | Built from | Starts at (cells) |
|---|---|---|---|
| kpi | One headline number | One measure, no breakdown | 6 wide, 4 high |
| bar | A number by category, largest first | A measure and a breakdown | 12 wide, 8 high |
| line | A number over time | A measure and dates | 12 wide, 8 high |
| table | The rows themselves, as a sheet | Anything | 12 wide, 8 high |
| text | Written analysis | Words | 12 wide, 8 high |
| header | The report's logo, name and subtitle | The header button | 24 wide, 3 high |
The page is 24 cells wide, so every starting width is a whole fraction of it. Four kpis make a row and two of anything else do. When cherry builds a pack it lays the blocks out in bands that way: headline kpis across the top, then trends, then breakdowns, then analysis beside the table it is about.
What every data block stores
A kpi, bar, line or table stores a selection: the metrics, dimensions, columns, named filters and conditions it asks the semantic fluid, and a row limit. It never stores rows. Each time the report is opened, printed, shared or emailed, sanda asks the question again, with the report's filters folded in.
A report with many blocks asks a few of them at a time, so it fills in from the top rather than all at once at the end. A block that asks exactly what another block asked a few seconds before can be answered from that answer, without asking your warehouse again.
A block returns at most 200 rows. In the builder the row limit starts at 15 and you can raise it to 200.
If the fluid cannot answer a block, for example because a report filter's field does not reach the block's table, the block shows sanda's sentence saying why instead of a chart. A block that runs and finds nothing says That ran and matched no rows.
How a block decides what to draw
The kind you choose is what you asked for, and the rows that come back decide what can honestly be drawn. When the two disagree, sanda draws the nearest true mark and says so in a caption at the foot of the block, such as "drawn as a bar: a line needs dates along the bottom".
| You chose | The rows are | Drawn as |
|---|---|---|
| Anything | No measure to plot | A table |
| kpi | One number | A kpi |
| kpi | A number with a breakdown | A line if the breakdown is dates, otherwise a bar |
| line | A number by dates | A line |
| line | A number by anything else | A bar |
| line | One number | A kpi |
| bar | A number by category | A bar |
| bar | One number | A kpi |
| table | Anything | A table |
A breakdown counts as dates when there is exactly one breakdown column and its first value starts with a year and month, such as 2026-09 or 2026-09-30.
kpi
A kpi is one large number with the measure's name under it. Numbers under 10,000 show in full, with up to two decimals. Larger ones are shortened: 12,345 reads as 12.3K, 482,000 as 482K, 1,250,000 as 1.3M. A missing value shows as a lone dash.
When the metric has a Shown as or a Unit in the semantic fluid, the number takes it: a percent metric reads 72% rather than 0.72, a currency metric in AUD reads AUD 184K, and a metric with a unit of kg reads 81.25 kg. A whole number shows no decimals. A target's figure and the gap to it are written the same way. The change on the previous period is always a percentage change, whatever the metric is. The same applies to the values a bar and a line print.
A kpi has two optional extras.
Compare with the previous period. Tick this in the builder and the kpi shows the change against the period before, for example +4.1% vs previous period. sanda finds the block's one date-range condition, slides it back by its own length, asks the same question again and works out the change. The change is shown to one decimal place when it is under 10% and as a whole number above that. An increase uses your report's up colour and a decrease its down colour (see Report colours and logo).
The comparison needs the block to have exactly one date-range condition, including any a report filter supplies. With none, or with two, nothing is compared. If the earlier period has no value, the kpi says no previous period to compare. If its value is zero, no change is shown, because a change from zero has no size.
A target. Enter a figure and, if you like, a name for it (up to 40 characters, "target" by default). The kpi then says how far it is from the figure, for example "25 above target (80)", "3.1 below goal (4)" or "on budget (80)". The gap is stated in words and never coloured, because whether above is good is for the reader to decide.
bar
A bar block draws a number by category, largest first, in a single colour with each value at the tip of its bar. It shows as many bars as the block's height allows, up to twelve, and the caption says how many smaller ones are not shown. Negative values draw to the left of a zero line.
If the selection has more than one measure, a chip for each appears above the bars and you switch between them.
Click a bar to filter the whole canvas to that category. sanda adds the filter to the report's filters and opens the filters pane so you can see it and remove it. This works when the first breakdown is a dimension without a time grouping, or a raw column with no summary.
line
A line block draws one measure over dates. It labels the first and last points, shows each point's value when you hover, and marks every point when there are 24 or fewer. The points are sorted by date. Dates are labelled by month and year when every point falls on the first of a month, and by day otherwise.
A target on a line is drawn as a dashed rule labelled with its name and figure. It is a reference, not a second series.
table
A table block shows the rows the selection returned. It is the one block that grows an instrument: a header you can sort by, a footer with totals and a selection summary, formats, hidden columns, columns of your own written as formulas, and an export to Excel. That has its own page: Sheets and formulas.
text
A text block holds written analysis, and cherry is what writes it. To add one, draw a box, choose ask cherry and pick written analysis, or ask cherry in its pane. The canvas has no editor for the words themselves. To change what a text block says, press the sparkle icon in its header (rewrite against today's numbers), which asks cherry to rewrite it against the current figures, or ask cherry to change it.
The analysis is plain paragraphs with two bits of markup:
- A line that starts with
-is a bullet. - Text between double asterisks, like
**this**, is bold.
cherry is told to use only figures that came back from a query it ran in that conversation. A sentence about a number goes stale in a way a chart does not, so on the canvas the block's footer records when it was written, for example "written 30 Sep · numbers as they were then".
header
A header block is the report's masthead: your logo (or a coloured bar when there is none), the report's name in a display size, and a subtitle, which is the report's description (on the canvas, today's date when there is none). Add it with the header button in the toolbar. A report has at most one, always at the top. cherry never places one.
Where each feature shows
Not every feature travels to every place a report goes.
| Feature | Canvas | Shared link and portal | |
|---|---|---|---|
| Numbers | Live | Live | As at the send time |
| kpi comparison with the previous period | Yes | Yes | Yes |
| kpi and line targets | Yes | Yes | Yes |
| A metric's Shown as and Unit on kpi, bar and line figures | Yes | Yes | Yes |
| Click a bar to filter | Yes | No | No |
| Sort, select and export a table | Yes | Yes | Not applicable |
| Comments | Yes | No | No |
In an email, a table shows its first 10 rows, and a line is drawn as filled columns that trace its shape, because inboxes do not draw charts.
Something unclear or out of date? Tell us, and we will fix the page.