A tour of the console
Every area in the console's left navigation and what it is for, plus the top bar, the usage meter and the cherry pane.
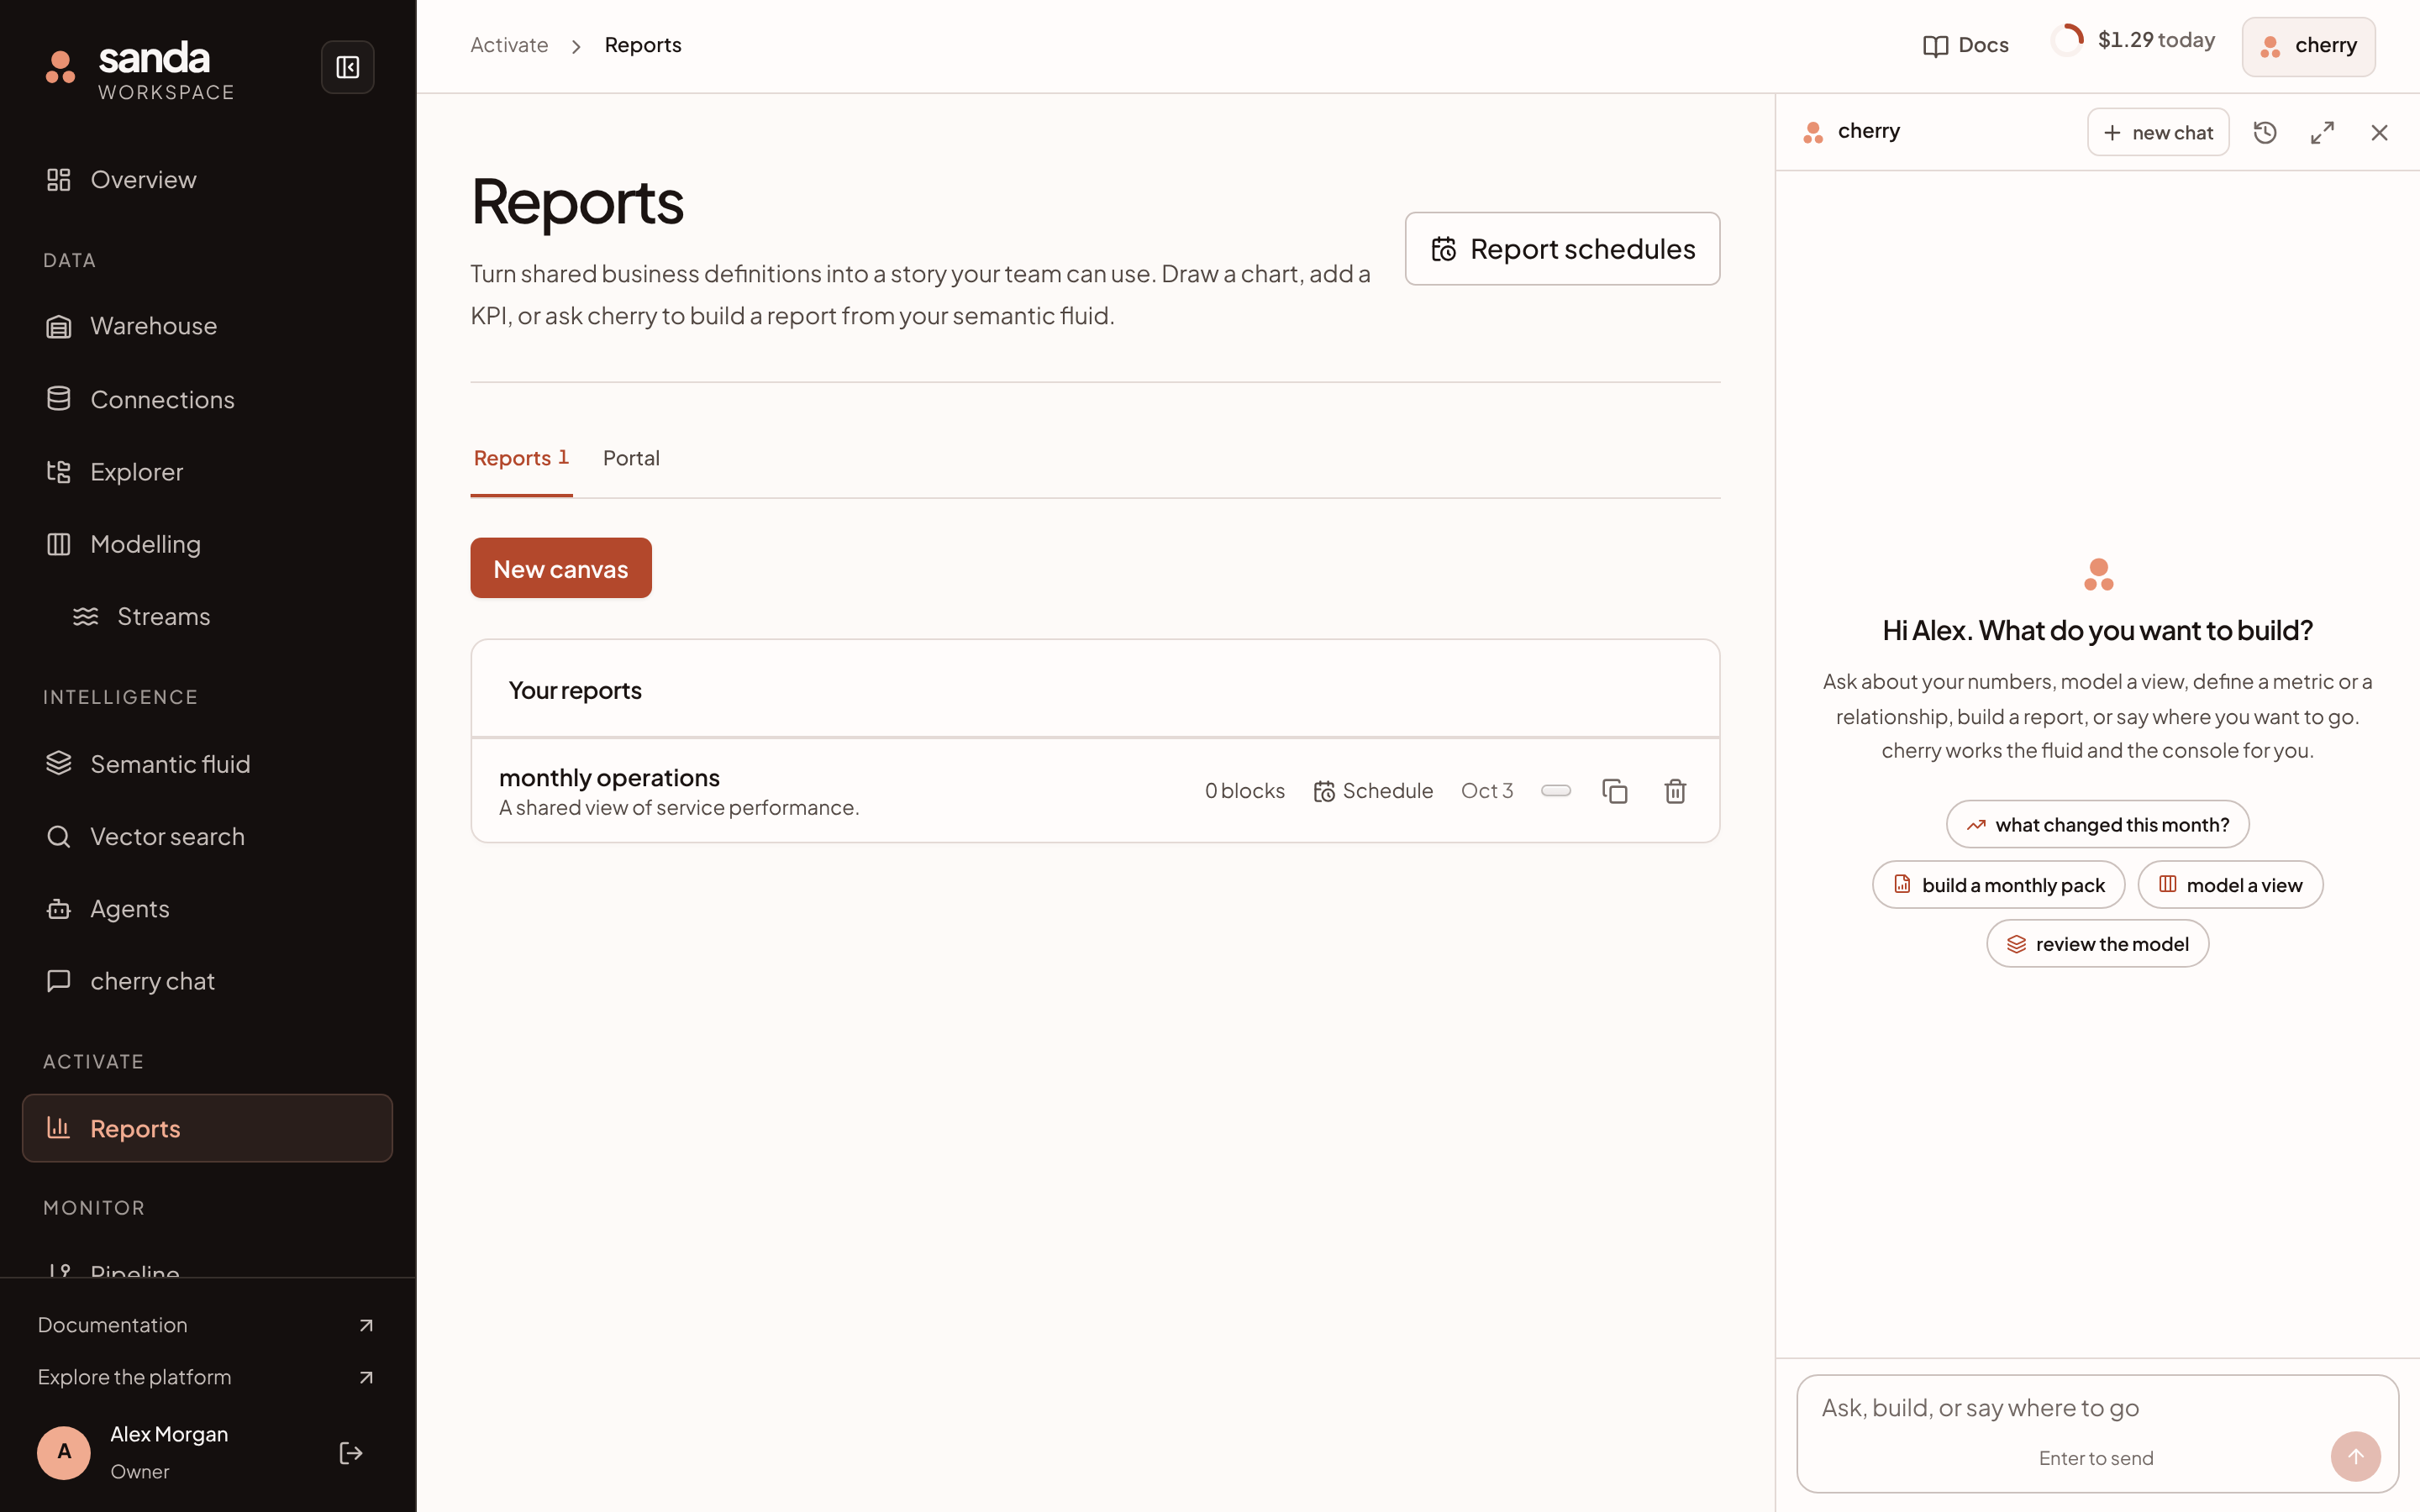
The console is where you work in sanda. Sign in at console.sanda-os.com.au. It has three parts: a navigation rail on the left, a top bar, and the page itself, with cherry in a pane on the right.
The left navigation
The rail is grouped in the order the work happens: data comes in, meaning is added, results go out. Your workspace name sits at the top. Press the panel icon beside the sanda wordmark to fold the rail down to icons. sanda remembers the choice in that browser. On a phone the rail becomes a drawer behind the menu button.
| Group | Area | What it is for |
|---|---|---|
| Overview | Your home page. cherry's message box, your recent conversations, headline counts (connections, rows synced, semantics, reports, live schedules, conversations), recent activity, and account usage and spend. On a new workspace it offers the setup steps. | |
| Data | Warehouse | Provision warehouses and watch their storage, compute and limits. Each warehouse card opens the Explorer, the Optimise page and the SQL shell. See warehouse. |
| Connections | Every connection and its sync status. Add one with New connection, or load a file with Load a CSV. See connections. | |
| Explorer | Browse every schema, table, view and procedure in a warehouse, with columns and the first rows. It is read-only. See the explorer. | |
| Modelling | Build views, materialized views and procedures in your warehouse, and the tasks that keep them fresh. See modelling. | |
| Intelligence | Semantic fluid | The map of your tables, relationships, metrics, dimensions and filters, and the queue of suggestions to review. See semantic fluid. |
| Vector search | Search the text inside your records by meaning, and manage search services. This is sanda search. See search. | |
| Agents | AI assistants connected over MCP: what they can reach, what they did, and an approvals queue. See MCP. | |
| Activate | Reports | Your reports, in a Reports tab, and the reports portal, in a Portal tab. Report schedules sets up email deliveries. See reports. |
| Push | sanda's numbers written into fields on your Salesforce records, and what each run sent. Listed once Push is switched on for your console. See Push. | |
| cherry chat | The same conversation as the cherry pane, full screen. See cherry. | |
| Monitor | Pipeline | One timeline of what runs and when: syncs, task runs and report deliveries. |
| System | Settings | Workspace, Appearance, Plan & budget, cherry, Security, Integrations, Team, and Close or delete. |
| Support | Send a message to sanda and see your tickets. See getting help. |
Vector search and Push show a small edition tag on Basic, because sanda search and Push are included from Standard. The pages still open, and explain what your edition includes.
cherry chat sits on its own between Activate and Monitor. At the foot of the rail, Documentation opens these docs and Explore the platform opens sanda's public site. Your name and role sit beside the sign-out button.
The top bar

From left to right, the top bar shows:
- Where you are. A breadcrumb such as Data, then Connections.
- The trial pill, on a trial only. It reads "Trial", then the free credit you have left, then the days remaining. It turns amber when the credit is nearly spent or few days remain, and red when the credit is used up or the trial has ended. Press it to open Settings · Plan & budget, where the credit meter shows what it has gone on.
- Docs. It opens the guide to the page you are on, here on docs.sanda-os.com.au, in a new tab. On a phone it is the book icon.
- The AI usage ring. A ring that fills as you use your daily AI limit, with today's spend beside it on a wide screen. Press it to see today's use against the limit, the month so far, and when the day resets, with a link to change the limit. All amounts in the console are Australian dollars.
- The cherry button. It opens and closes the cherry pane. A small dot appears when cherry has replied while the pane was closed.
The cherry pane
cherry sits in a pane on the right of every page except Overview and cherry chat, which are cherry already. Open and close it from the top bar, or with ⌘ J (Ctrl J on Windows).
The pane keeps its conversation as you move between pages, so you can ask about a table on the map, then go to Reports and carry on. When cherry takes you somewhere, the pane opens beside the page. Along the top of the pane:
- new chat starts a fresh conversation.
- The history icon lists your conversations. They are yours, and you can search them.
- The expand icon opens the conversation full screen.
- The close icon closes the pane.
Drag the pane's left edge to resize it. On a phone the pane takes the whole screen, and the close button is the way back. See ask cherry.
Related pages
Something unclear or out of date? Tell us, and we will fix the page.