Query the fluid
Pick a metric, the dimensions to slice it by and the filters your team has named, and see the rows. sanda composes the SQL, with no AI involved.
The workbench is the quickest way to see what your fluid does. You pick a metric, a dimension and a filter, and sanda composes the SQL from your definitions, runs it and shows the rows. No AI is asked anything, so the same picks always give the same SQL, and pressing clear costs nothing.
Use it to check a new metric, to answer a quick question, or to see how the agent would read a definition.
Open it
Above the map is a bar that reads "query semantic fluid" with an open button. Press either, and the workbench opens as one card over the whole map. The map stays behind it, scaled back and greyed, and returns exactly as you left it when you close the card. Press Escape or the cross to close it.
Underneath the bar, a line says how much there is to pick from: every metric, dimension, filter and column across your tables.
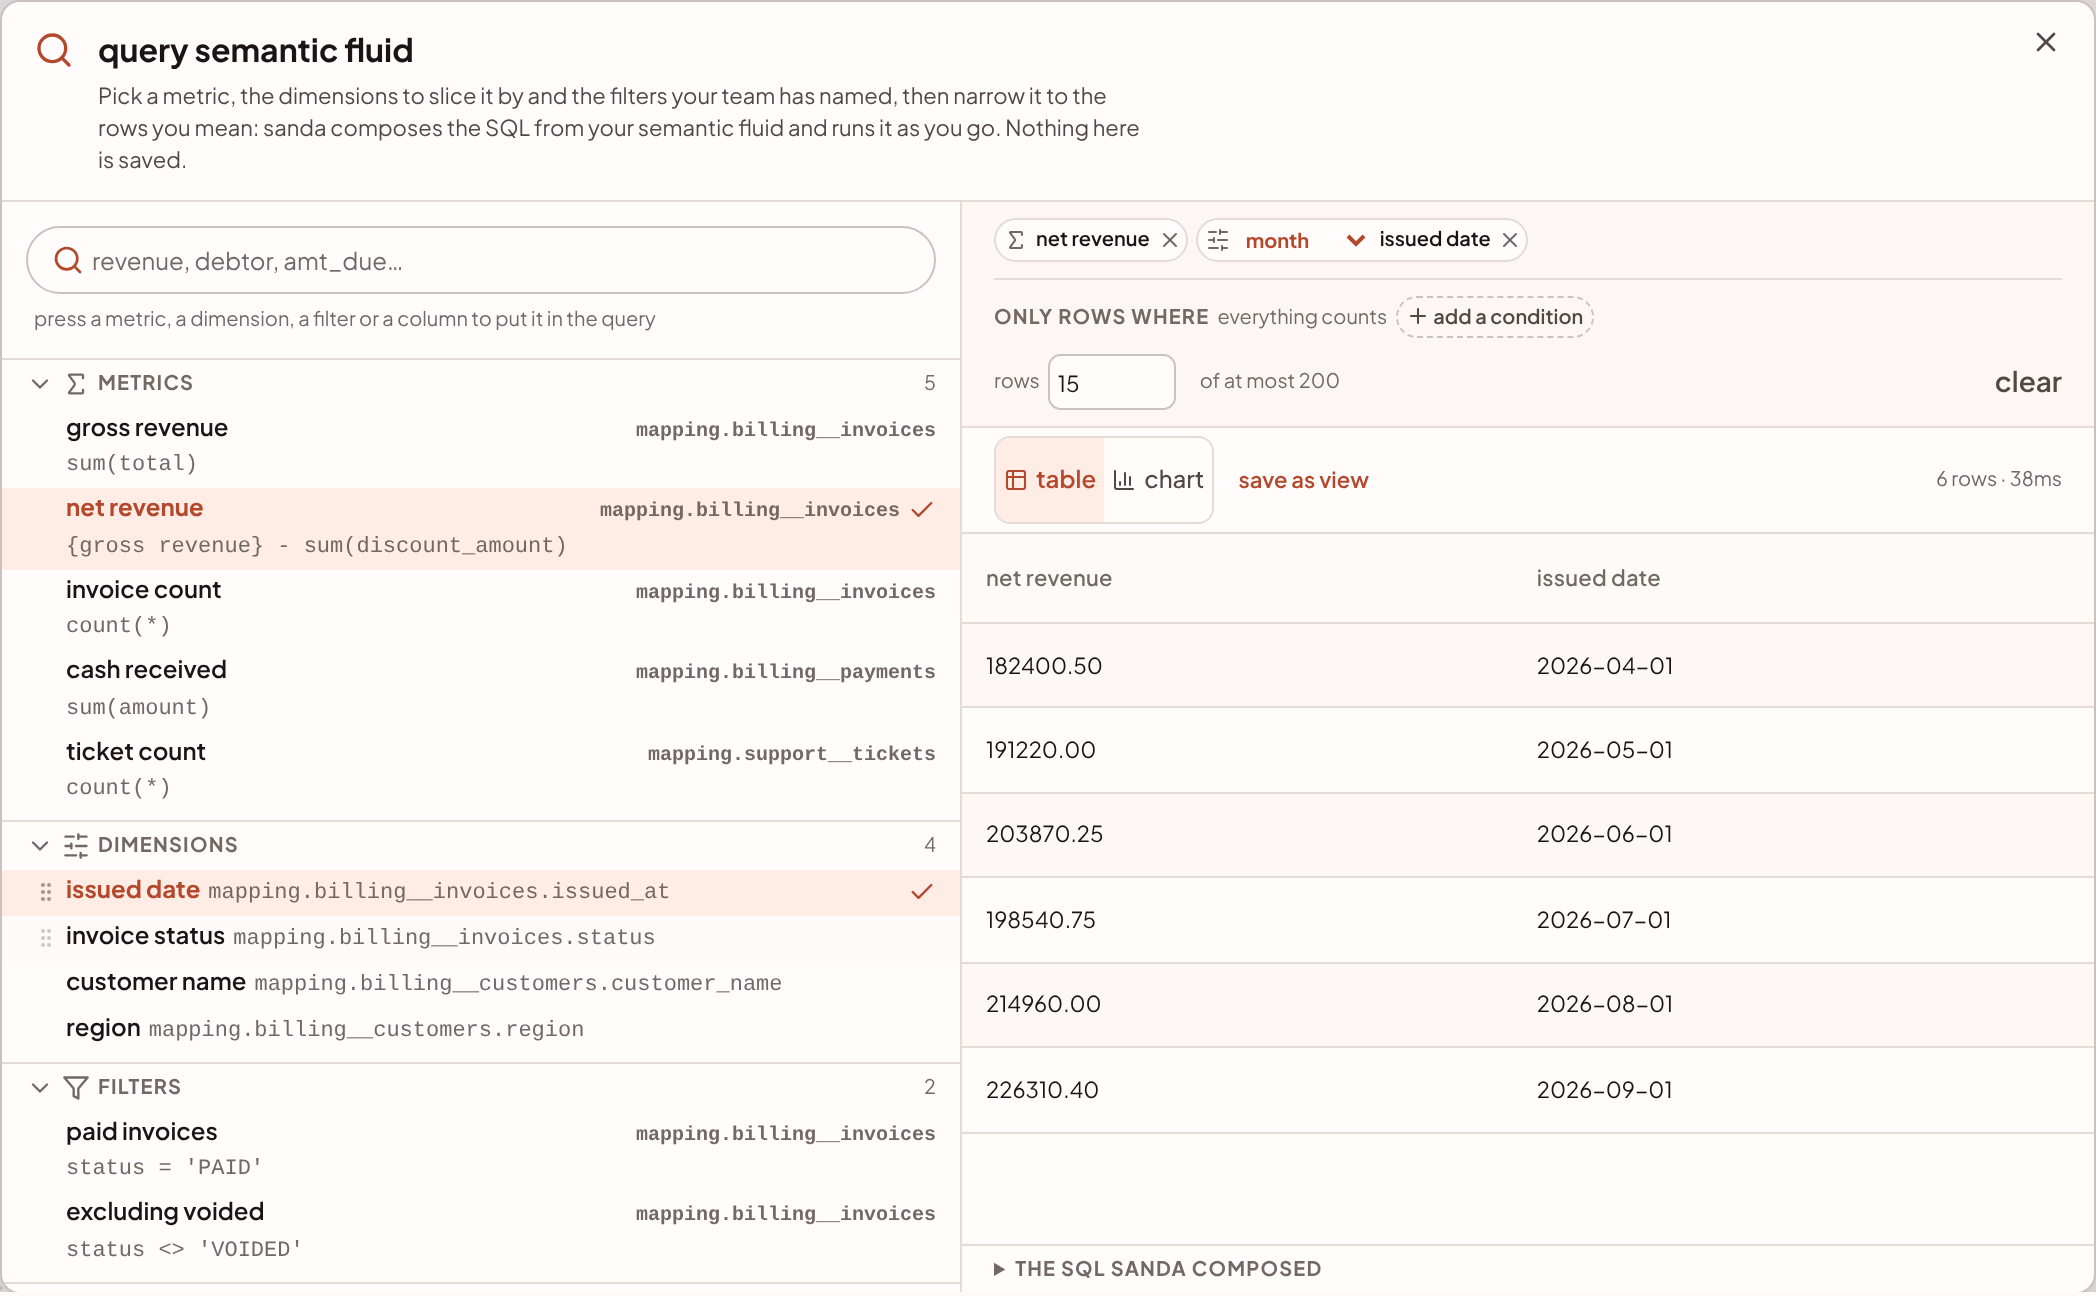
Pick what you want to see
The left half is your fluid in four folders: metrics, dimensions, filters and tables, where each table lists its columns. The search box at the top is ready as soon as the card opens. It narrows every folder as you type, matching names, definitions, other words and column names, so typing debtor finds a metric called amount owing if debtor is one of its synonyms. A table whose name matches keeps all its columns.
Press a row to put it in the query. Press it again to take it out. You can also drag it across to the right half. Each table has a button, labelled for example "Show invoices on the map", that closes the card and centres that table on the map.
The right half is your question:
- Chips show what you have picked. A cross takes one out.
- The result appears below, and updates on every change. There is no run button.
- The sql sanda composed is one press away at the foot.
The order you pick things in does not matter. Put a dimension down and drop a number on it, and the number is worked out by that dimension. "Product" then "revenue" is the same question as "revenue" then "product".
Summarise a column, group a date
Two controls sit on a chip, because they belong to that one use of the field.
- How a raw column summarises. A plain numeric column such as
unit_pricecan be added to a query, but sanda never assumes what you meant. Choose sum, avg, min, max, count or distinct count on its chip, and the column header says which, for examplesum of unit_price. An implicit sum is how a list price gets added up across a join and read as revenue. sum and avg appear only on numeric columns. The default, as it is, lists the column. - How coarsely a date groups. A time dimension's chip offers each row, day, week, month, quarter and year. Without a grain you get one row per timestamp. Grouping something that is not a date is refused with a sentence.
Narrow the rows
Press add a condition to narrow this question. Choose a field, an operator and a value. The operators offered depend on the field's type, so a date is compared with "is within", "is before" and "is on or after", a number with "is at least" and "is between", and text with "contains" and "starts with". A date field also offers periods by name, such as yesterday, last 30 days and last quarter. sanda resolves them in your own time zone to an exact window, and the chip states the window it used. The full list is in filters.
A condition belongs to one question and goes when you clear it. A named filter is the workspace's own vocabulary. They are kept apart on screen for that reason: pick a named filter from the filters folder, and add a condition for anything nobody has named.
rows sets how many rows to show. The default is 15 and the most is 200. For more than that, narrow the question or use the OData feed.
Read the result
- table is the whole result, with every column and every row. A null is shown as
null, not as an empty cell. - chart draws one measure against one label as bars, largest first. It draws the top twelve and says so when there are more. It needs a number to plot, and it says so when there is none.
Rows come back in a sensible order without being asked: a number broken down by a label comes back largest first, so a page cut at the row limit is the top of the list, and a time series comes back in time order.
Everything you did not aggregate is grouped by. Put region beside net revenue and the SQL groups by region.
A row whose relationship finds no match is kept, with null on the other side, rather than left out. Revenue by product still adds up to total revenue when some order lines have no product: those lines are a group of their own.
Numbers from different tables
Numbers measured on different tables can sit in one result. Put revenue, summed over the order lines, beside order count, counted over the orders, and group them by customer country. Each order has many lines, so a single pass over the lines would count every order once per line. sanda works the orders out in a part of the query of their own instead, counting each order once by the table's key columns, and lines the two parts up by country. The SQL under the result shows both parts.
- The table counted this way needs its key columns set. Without them, sanda declines and says which table needs them.
- Each number keeps its own condition. A metric that counts only shipped orders beside one that counts every order gives both counts, not two counts of shipped orders.
- A metric built from metrics on other tables, such as
average order value, is worked out the same way. See metrics.
When sanda declines
Some questions cannot be answered honestly as one table, and sanda says so in a sentence where the rows would have been. It is drawn as prose, not as an error, because nothing failed: sanda declined to run it.
You will see a refusal when:
- the question needs two tables that each have many rows for the same thing, such as invoices and payments for a customer, joined to each other, and the sentence names the two tables and which one repeats,
- a number is measured on a table the join repeats, and that table has no key columns to count its rows once by,
- a column's name looks like it holds a secret, such as a password or a token, and sanda will not select it,
- a metric's definition uses a column that two tables share, and sanda cannot tell which is meant,
- a metric refers to another metric that is not defined,
- a column is asked to group by a period but is not a date, or
- you asked for a sum of a column that is not a number.
Read the sentence. It usually says which relationship or definition to fix. See relationships.
Keep a query as a view
Once a selection has run, save as view appears beside the table and chart toggle. It keeps that SELECT as a view in your warehouse and puts it on the fluid as a table, so a rollup you assembled in business terms becomes something sanda can query like any other table.
- Press save as view. A small form opens.
- Name it. Enter a name such as
revenue_by_month. It is lowercased as you type. Add a description if you want one. - Choose whether to store the rows. Tick "store the rows (materialized)" to build it now, on your compute, billed as it runs. A schedule under Modelling can rebuild it. Leave it unticked for a view that runs on read.
- Press create. sanda confirms where it kept it, and says it is under Modelling.
Nothing else in the workbench is saved. See views for what you can do with the result.
Something unclear or out of date? Tell us, and we will fix the page.