Monitor syncs
Follow a sync from the moment it starts, read the history of past runs, and know what sanda will and will not tell you when a run fails.
Three places tell you how your connections are doing: the list of connections, the run panel on a connection's Status tab, and its Timeline tab. Between them you can see whether data is fresh, how a run in progress is getting on, and what happened on every recent run.
The list
Data · Connections shows one row per connection with its Last sync, the Rows it has synced and its Status. See Connection statuses for what each status means.
While a connection is syncing, its row shows the run instead of the total: the number of rows this run has added, and how fast, for example +96K and 21.6K/s. Before rows start to move it says what stage the run is in, such as queued or launching. The list checks a syncing connection about every ten seconds, and only while something is syncing.
Follow a run
Open a connection and press Sync now, and the Status tab opens a run panel at once. It also appears when you open a connection that is syncing, whoever started the run and however it started, and it is the first thing on the page while the run goes on.
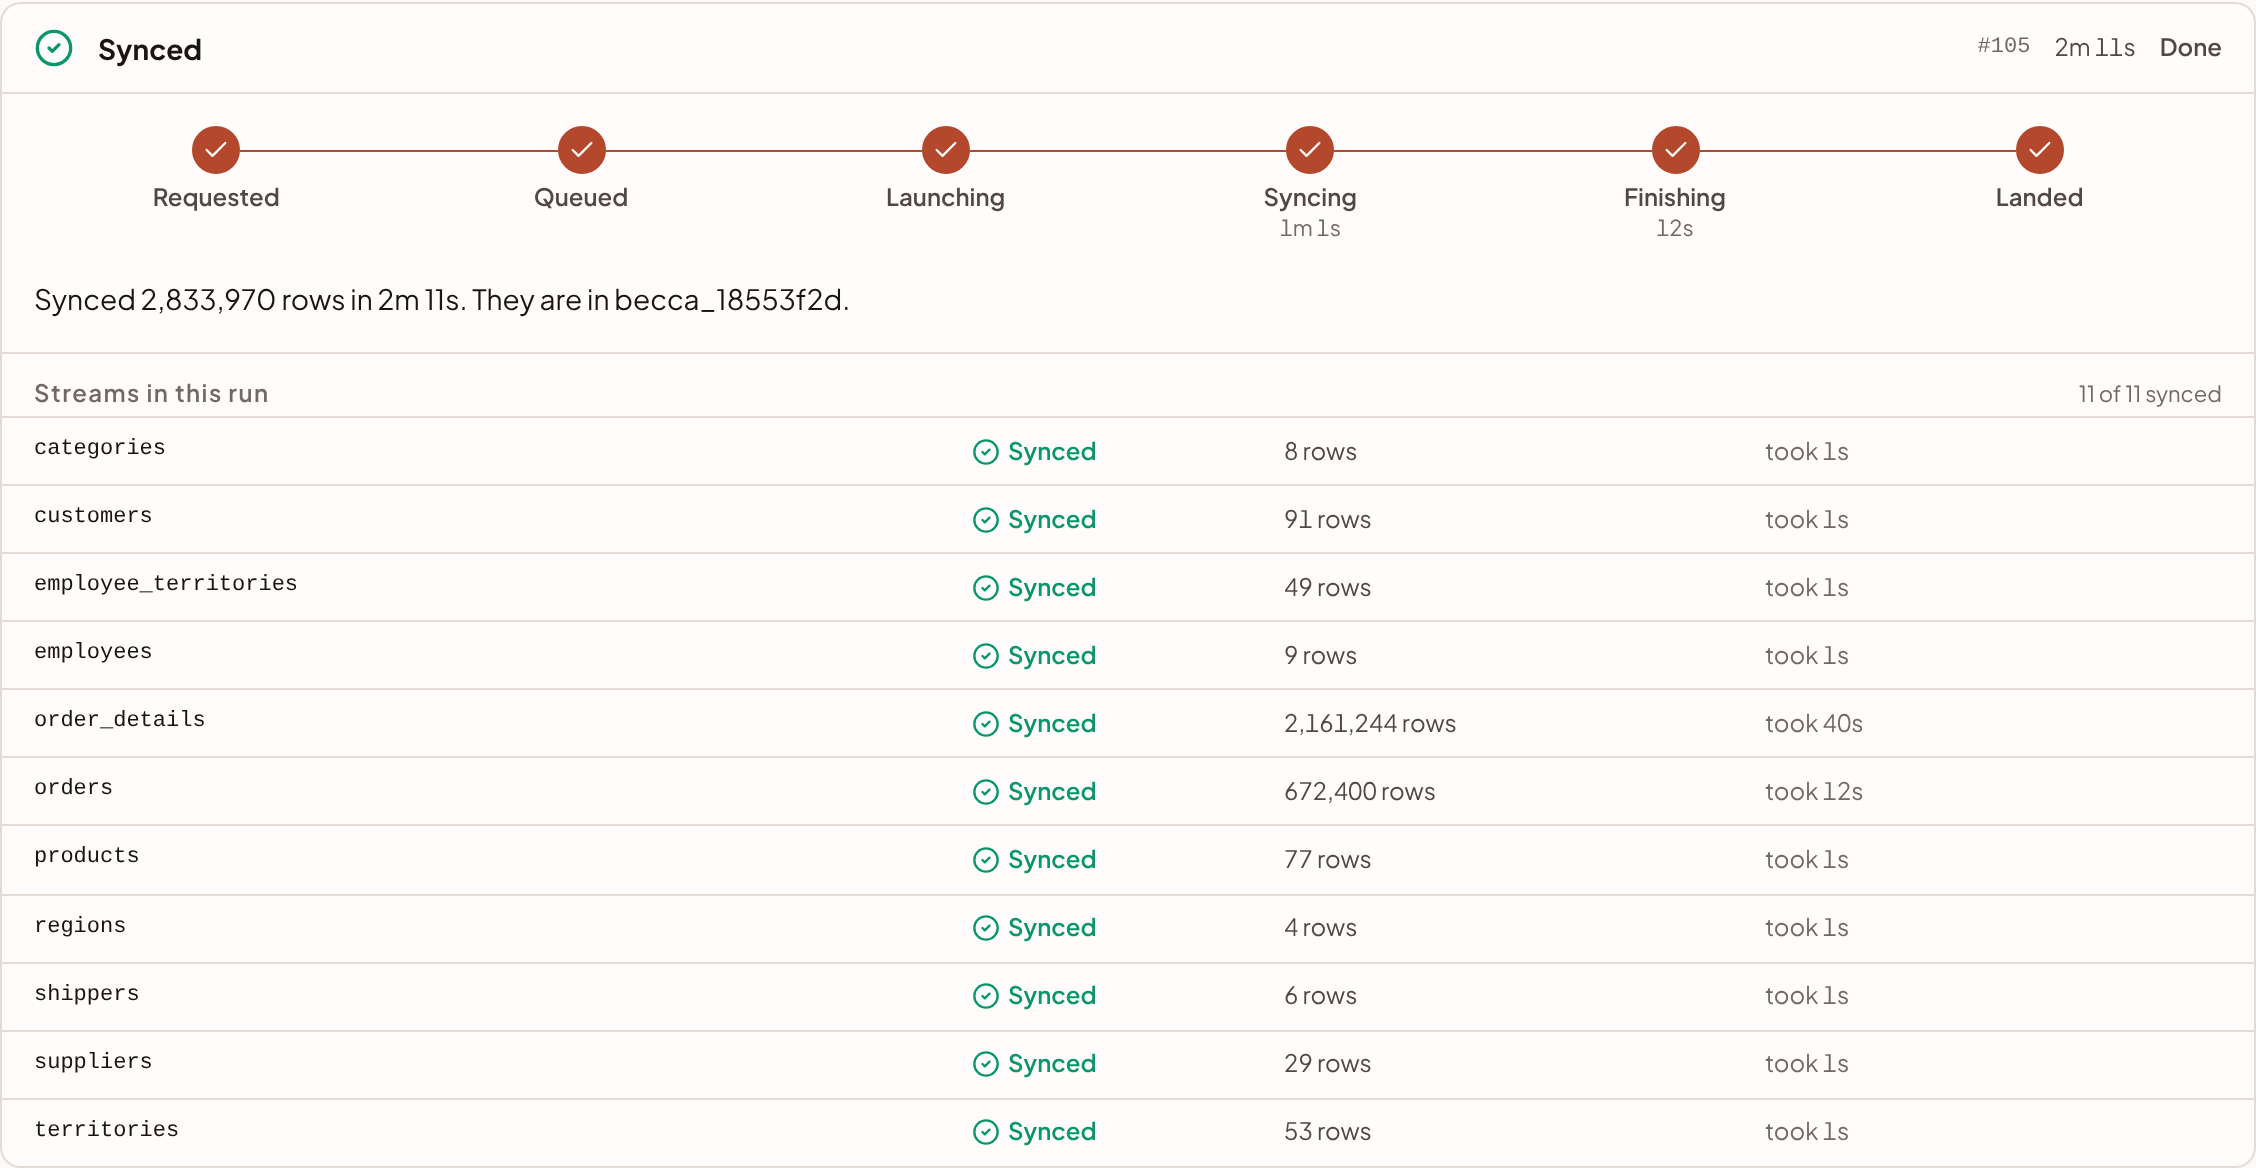
The six stages
A run moves through six stages, drawn as a track along the top of the panel. Each finished stage shows how long it took, and the current one counts up by the second.
| Stage | The panel says | What is happening |
|---|---|---|
| Requested | Starting a sync | You have pressed Sync now and sanda is asking for a run |
| Queued | Sync queued | The run is accepted and waiting for room to start |
| Launching | Launching the connector | sanda starts a fresh connector for every run, which can take a minute or two before the first rows move |
| Syncing | Syncing | Rows are moving. The sentence says how many streams are in and which one is on |
| Finishing | Finishing | Every stream has been read and the last rows are being written to your warehouse |
| Landed | Synced | The run succeeded and the rows are in your warehouse |
One sentence under the track says what the current stage means in plain words, for example Reading from PostgreSQL into acme_warehouse: 4 of 11 streams synced. Now on orders. When a run has to try again, it adds An earlier attempt stopped, so this is attempt 2.
A stage that the page did not see begin, because you opened it partway through a run, shows no duration rather than a guess.
The numbers
Once there is something to count, a row of figures appears under the sentence.
| Figure | What it is |
|---|---|
| Rows read or Rows landed | How many rows the run has moved so far |
| Rows per second | How fast rows are moving right now |
| Data read or Data landed | How much data the run has moved so far |
| Data per second | How fast data is moving right now |
The label tells you which count you are looking at. Rows read is the number read from the source, and it moves as the run goes. Rows landed appears when sanda can only see what the warehouse has committed. That count can stay at zero for most of a run and then jump, because a full refresh commits late.
Rows per second is the rate over about the last minute. It is measured between the moments the count moves, so it stays steady even when the count only updates every few seconds. Until sanda has seen the count move twice, it shows the run's average so far and says so. Beside the current rate, the panel shows the average once it has one, for example 21.6K on average.
If the count stops moving for a minute and a half or longer, the rate reads zero and says nothing new for how long it has held. The sentence changes to Reading from … but nothing new has arrived for a while. The source may be slow to answer, or waiting out a rate limit. A source that is slow, or rate limiting sanda, looks exactly like this. So does a run that has hung.
Streams in this run
The table under the figures has one row per stream in the run, with its state, its rows and its time.
| State | Meaning |
|---|---|
| Not started | Waiting its turn |
| Syncing | Being read now, with how long it has been going |
| Rate limited | The source asked sanda to wait, with the time it will retry, such as until 3:15 PM |
| Synced | Done, with how long it took |
| Failed | Stopped with an error |
| Cancelled | Stopped before it finished |
| In this run | The stream is part of the run, but sanda has no state for individual streams on this run |
When a run has more than 15 streams, the table opens on the ones worth looking at (syncing, failed or rate limited) and a few more, with Show all N streams to see the rest and Show fewer to fold it back.
When the run ends
The panel's title changes to Synced or Sync failed, and stays until you press Done. A run that landed says Synced 2,833,970 rows in 2m 11s. They are in acme_warehouse. A run that failed says where it stopped, for example The run stopped while syncing, after 2m 3s. The reason is above. The reason itself appears above the panel. See Troubleshoot connections.
What the connection page shows
Above the run panel, four figures describe the connection itself. They stay the same while a run is going, because they are the connection's own facts and not the run's.
- Rows synced is a running total of the rows moved by every successful run. A full refresh counts the whole table again each time, so this is a measure of work done, not the size of your tables.
- Data moved is the same for data.
- Last sync is when the last run finished.
- Next sync, or Frequency on a manual connection. See Sync schedules.
Lower on the page, Lands in shows the table prefix, such as raw.acme_xero_au__*, with one table per stream. Processed in shows where the rows are loaded and processed: your workspace's data region, such as Australia (Sydney). Loading, staging and modelling stay in that region.
Once rows have landed and nothing from the connection is on your map yet, a banner offers Learn from my data. Pressing it asks cherry to read the new tables and propose what they mean. See Learn from your data.
Sync history
The Timeline tab lists the last ten runs of the connection, newest first. The tab's label carries the count.
Each run shows:
- Sync and a status: queued, running, succeeded or failed. A run in progress shows its stage instead of running.
- Its rows and data size, how long it took, and for a run that succeeded, its rows per second.
- N attempts when it needed more than one, in red for a run that failed. One attempt is normal and says nothing.
- When it started, and its run number, such as
#105. - The reason, in red, when it failed.
A run that was cancelled before it finished is recorded as failed, with a note saying it was cancelled. A run that failed without a reason says so, and Check status asks again.
A run that sanda lost track of, because a newer run started before it saw the first one end, is closed as failed with a note that begins sanda lost track of this run.
If a run still reads running after twelve hours, the row adds Still reported as running. Press Check status to settle it.
Keeping the page up to date
While a connection is syncing, its page checks the run about every six seconds, and about every two while it is queued. You do not need to refresh.
A scheduled run that nobody is watching is caught up by sanda's own check, which runs every 15 minutes. Until it does, anything that reads sanda's record rather than the run itself can show a run that finished at 2:01 as still syncing at 2:05. Opening the list, or a connection that reads Syncing, checks the run straight away, and so does pressing Check status.
Check status re-reads the latest run from sanda's managed sync and updates the page. It says what it found: Status checked: the page shows the latest run., or that nothing has run yet. It also retries making landed tables readable, which is how a connection that reads Error with a message beginning Rows landed, but sanda could not attach clears once you have fixed the cause.
Other places to look
- Overview. The Rows synced tile totals every connection. Recent activity records Connection added, Source connected, schema read, Connection handed to sync, Stream selection changed, Sync schedule changed, CSV loaded into warehouse and Connection removed.
- Monitor · Pipeline. Every recorded sync as a bar on the account schedule, next to the tasks and deliveries that follow it. See Sync schedules.
- cherry. Ask whether your data is fresh, or why a sync failed. cherry can read your connections and their recent runs, and can start a sync for you. Depending on your cherry settings, it asks for confirmation first. See Actions and approvals.
Notifications
sanda does not email you when a sync fails. A failed run shows as Error on the list and on the connection, with its reason, and the history keeps it. If you rely on a sync finishing, check Last sync or ask cherry.
sanda does email owners and admins, plus any extra addresses you add, about events that stop syncs:
- A warehouse near a limit, and at one. At 80% of a storage or compute limit sanda warns you. At the limit it pauses loading, which stops syncs, and tells you again.
- A budget. Reminders as the month fills, and a notice at 100% when the warehouse is suspended and syncs wait.
It also emails when a scheduled task, index build or report delivery fails. Set who is told under Settings · Plan & budget, in the Budget & alerts panel. See Budgets and AI limits.
Something unclear or out of date? Tell us, and we will fix the page.