Pipeline and scheduled tasks
See every sync, task, index build and report delivery on one timeline, find what failed, and understand the schedule grid.
The Pipeline page is where everything that runs on a clock is watched. It draws your syncs, the tasks that rebuild your models after them, the search indexes that refresh, and the report deliveries that go out, on one page, so you can see what runs, what it depends on, and when it reaches your team.
Go to Monitor · Pipeline. Every member can read it. Owners and admins can also change when things run from here. Press Refresh at the top right to reload it.
The four stages
The Your pipeline panel lays the work out in the order data moves.
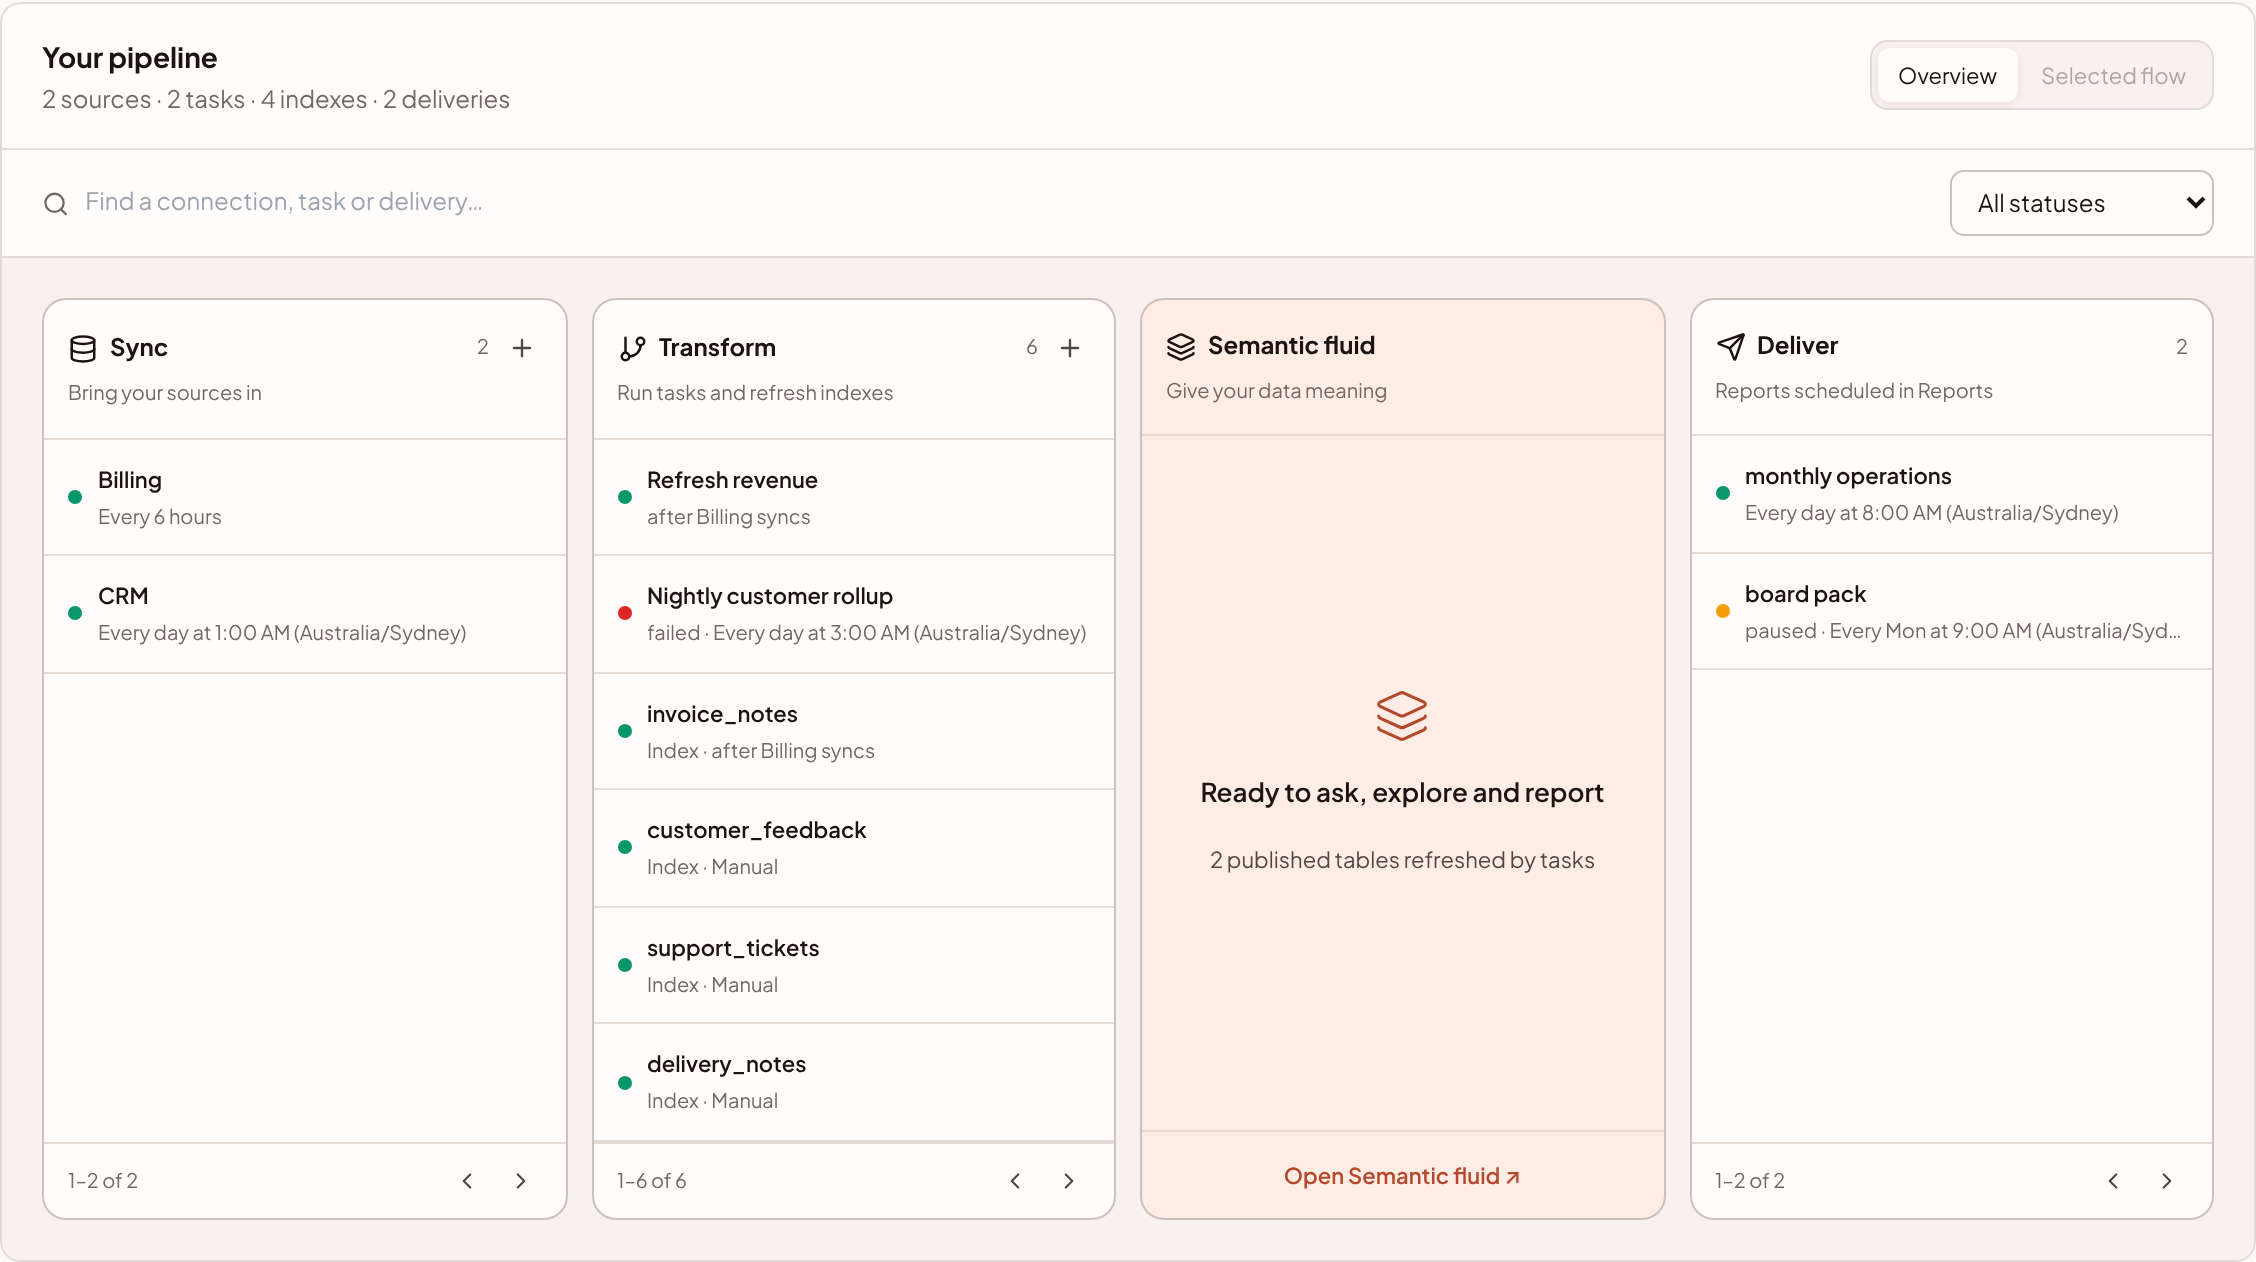
| Stage | What is in it | Where you manage it |
|---|---|---|
| Sync ("Bring your sources in") | Your connections, each with how often it syncs. | Connections |
| Transform ("Run tasks and refresh indexes") | Your tasks, and your search indexes marked Index. | Tasks and sanda search |
| Semantic fluid ("Give your data meaning") | A summary of how many published tables are refreshed by tasks. | The semantic fluid |
| Deliver ("Reports scheduled in Reports") | Your scheduled report deliveries. | Delivery |
The panel's subtitle counts them, for example 2 sources · 2 tasks · 4 indexes · 2 deliveries. The Sync, Transform and Deliver stages list six items at a time, with arrows to page through. Sync and Transform also have a +, which opens Connections or the Tasks tab.
Each row shows a coloured dot, the name, its state and when it runs. A red dot means the last run failed, or a task is suspended. Amber means paused. Green is fine.
To find something, type in Find a connection, task or delivery…. The status menu offers All statuses, Needs attention (failed or suspended), Active and Paused.
Selected flow
Select a connection, task or delivery and press Selected flow to draw just that item with its direct dependencies: the sync a task waits for, the tables it refreshes. Back to all returns to the overview. The button is disabled until you select one of those.
The inspector
Selecting an item opens an inspector beside the panel.
| Item | What you can see and change |
|---|---|
| Connection | When it syncs, its next sync and its last one. Owners and admins can change the schedule (Save sync time) and start one (Sync now). It also lists the tasks that run straight after it. Open connection goes to its page. |
| Task | Its state, cadence, next and last run. Owners and admins can change its schedule and its sync trigger (Save run time), press Run now, and Pause or Resume it. Open task to change its steps opens it in Modelling. |
| Delivery | Read-only. Times and destinations are managed in Reports: Manage in Reports. |
| Search index | Read-only. Manage it in sanda search: Open index. |
| Semantic fluid | The published tables that tasks keep fresh. |
Members who are not owners or admins see Only owners and admins can change when this runs.
The account schedule
Under the overview, Account schedule shows syncs, tasks, model runs, index builds and deliveries on one clock, one day at a time.
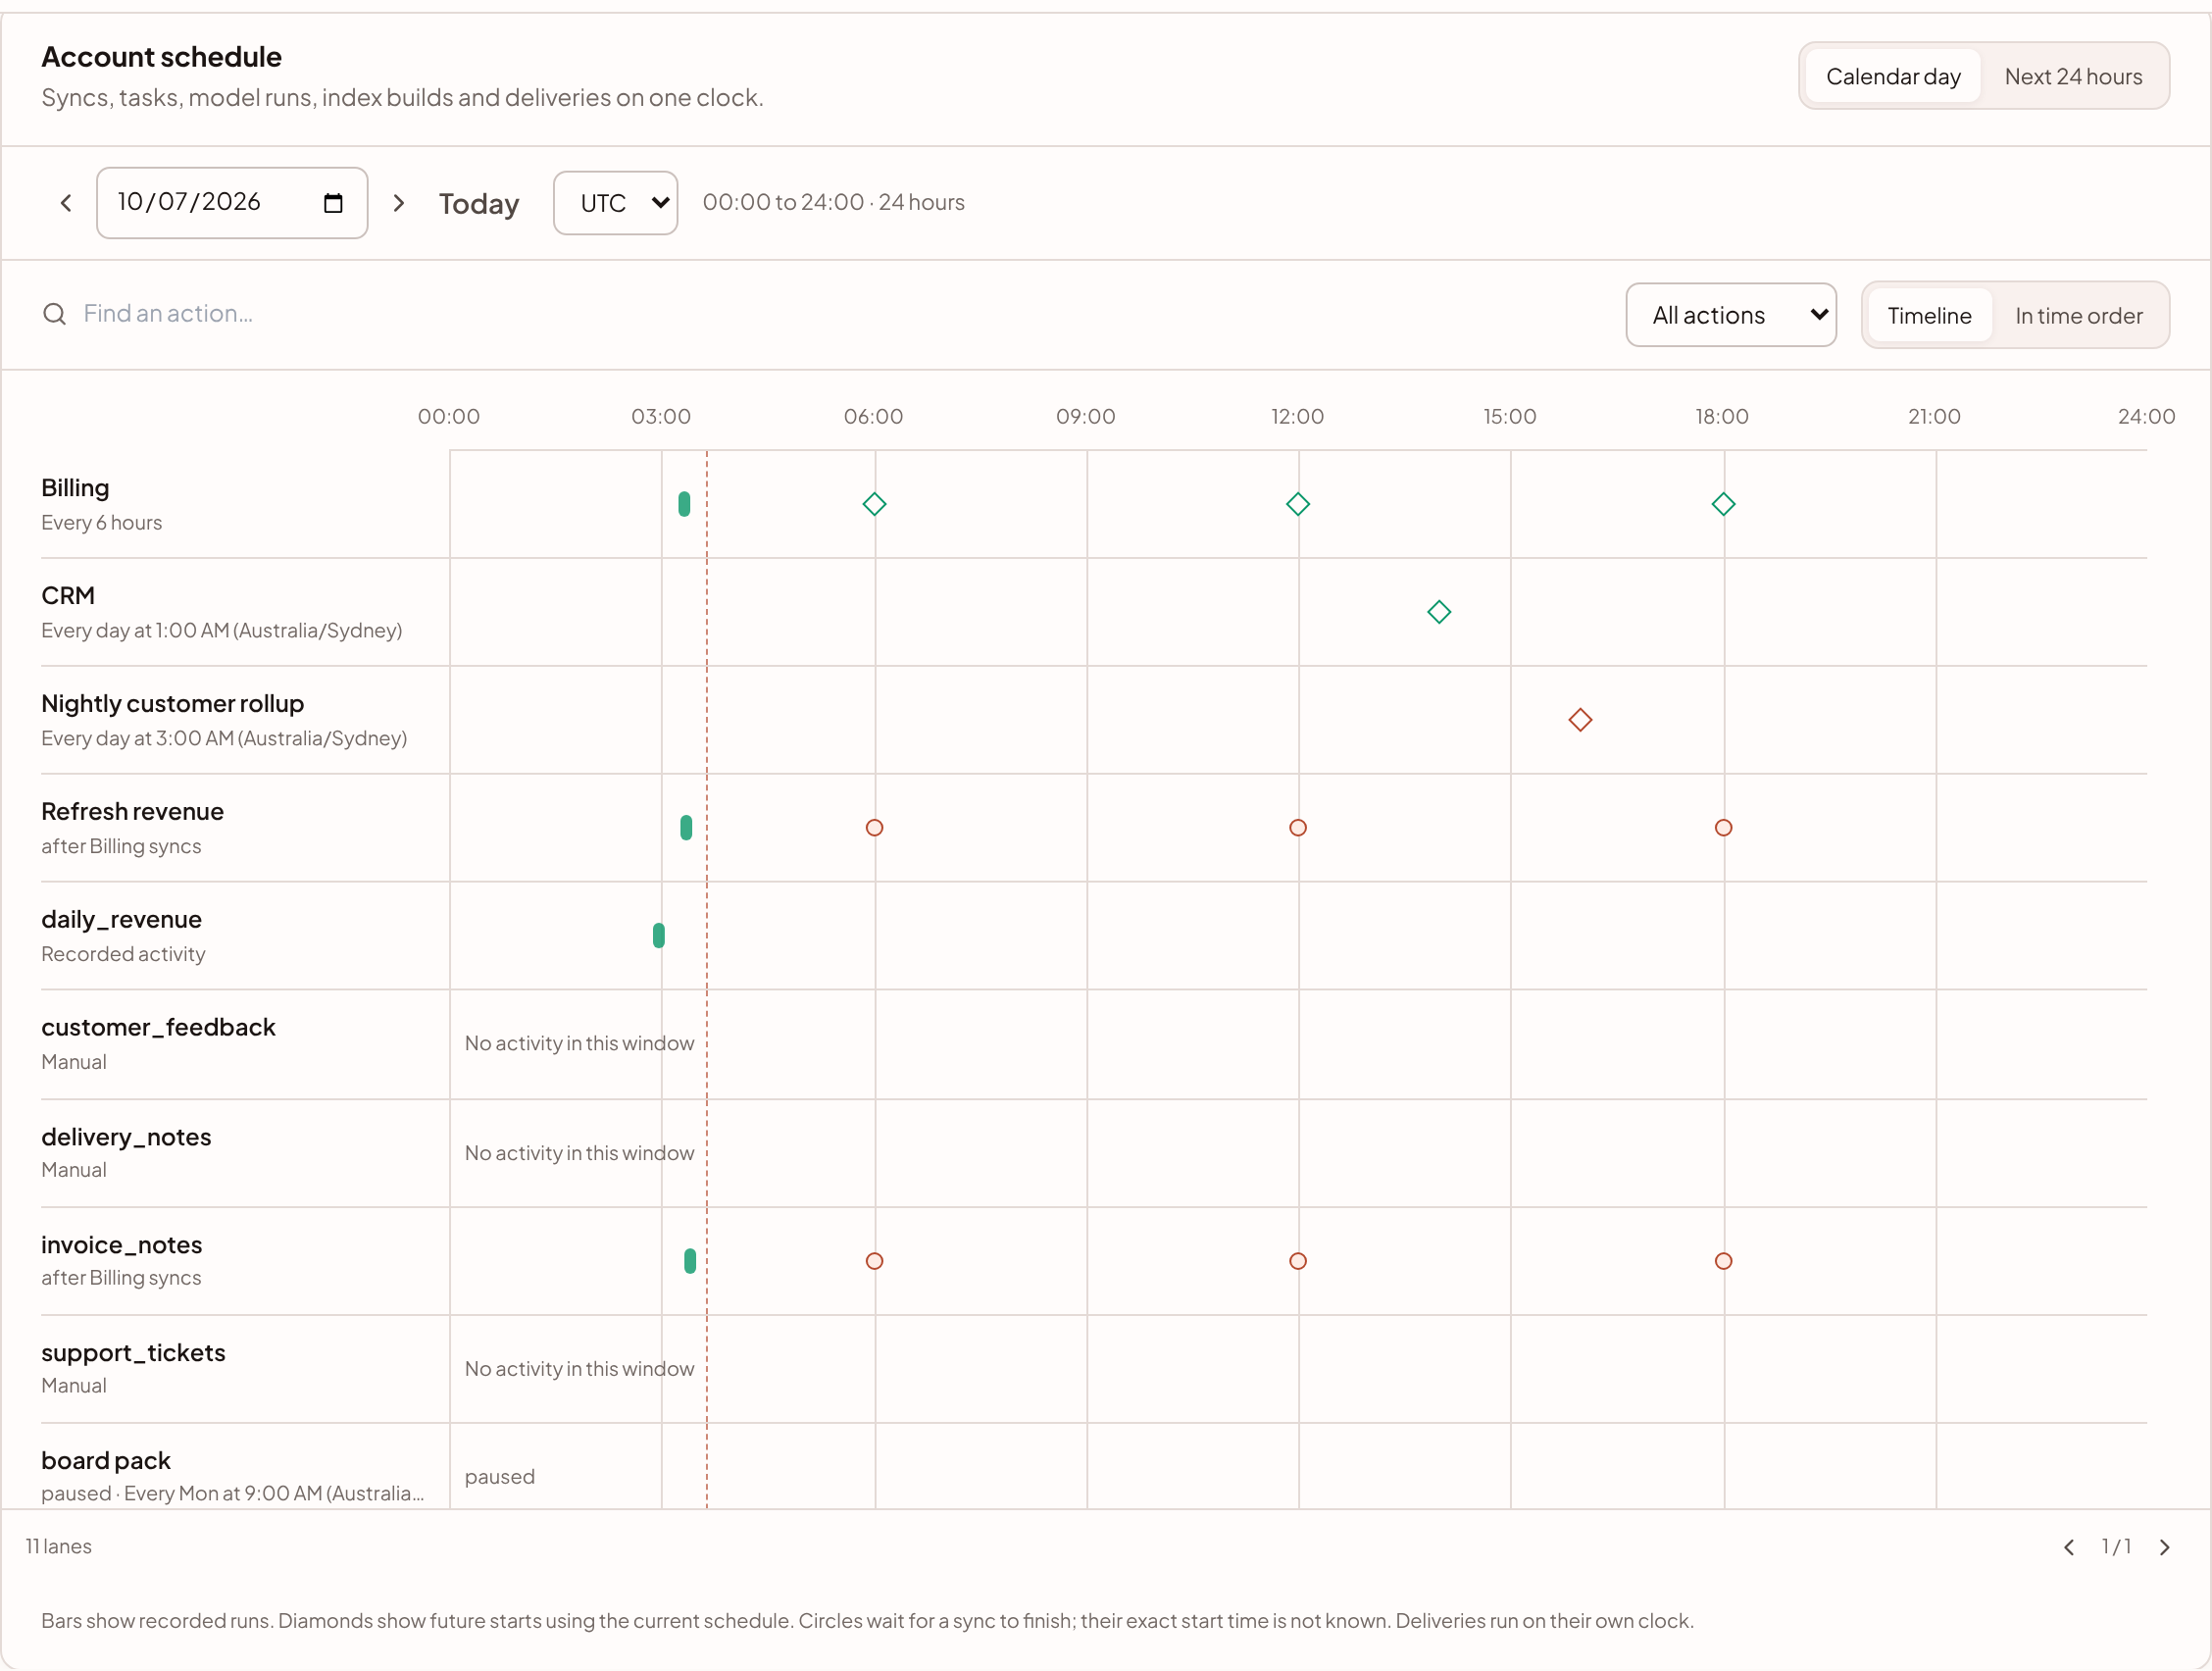
Read a lane like this:
- Bars are recorded runs, coloured by outcome. A bar starts when the run started and ends when it finished.
- Diamonds are future starts, worked out from the current schedule. They appear for today and days to come.
- Circles are runs that wait for a sync to finish. Their exact start time is not known, because it depends on how long the sync takes.
- The dashed line is now.
Model runs are builds, procedure calls and maintenance statements that ran outside a task. Index builds are sanda search refreshes.
You can move around:
- Calendar day shows 00:00 to 24:00. Next 24 hours shows the day ahead from now. Use Previous day, Next day, the date box and Today to move.
- The timezone menu chooses between your browser's timezone and UTC. A day on which the clocks change has 23 or 25 hours, and the header says so.
- Find an action… and the type menu (All actions, Syncs, Tasks, Model runs, Index builds, Deliveries) filter the lanes.
- Timeline shows the lanes. In time order lists the same events as an agenda, each tagged Recorded, Scheduled or After sync. Select a bar to open its lane in the agenda.
- If more than 2,000 runs were recorded in the window, Load more recorded activity fetches the rest. All scheduled starts are always shown.
The 15 minute grid
sanda's scheduler wakes every 15 minutes, on :00, :15, :30 and :45, and everything scheduled is held to that grid: tasks, connection syncs, search index refreshes and report deliveries. A schedule can only name one of those minutes, and the time pickers only offer them. A start set for 9:07 would run at 9:15.
The same wait applies to anything you queue by hand. Run now on a task queues a run, and it starts at the next quarter hour.
A run also has a ceiling, because it has to fit inside one tick: no task runs for longer than 14 minutes.
Find what failed
- Set the status menu to Needs attention. It shows anything whose last run failed, and anything suspended.
- Select the item. The inspector shows its last outcome, and for a task the state.
- Open the item to read the error. A task's runs list the error on the run and on each step. For a connection, see Monitor syncs. For a delivery, see Delivery.
A task that fails several times in a row pauses itself and shows suspended. Fix the cause, then press Resume. See When a task fails.
Failures are also emailed to your alert recipients, once a day for each task or delivery, if you have that switched on in Settings · Plan & budget · Budget & alerts.
When the workspace is suspended for its budget, scheduled work is held. Nothing is queued, and once the workspace is resumed each item carries on from its next slot, without replaying what it missed.
Something unclear or out of date? Tell us, and we will fix the page.