The map
The Semantic fluid page draws your tables as cards and your relationships as lines. Arrange it, select tables and open the panels around it.
The Semantic fluid page opens on the map. Each table you have put on the fluid is a card, each relationship is a line between two cards, and everything else (metrics, aliases, filters and so on) opens from a rail of panels on the left. The map is a picture of the fluid, not a separate thing: every card and line on it exists in the fluid, and every change you make on it changes the fluid.
Open it from Intelligence · Semantic fluid, or open Semantic fluid directly.
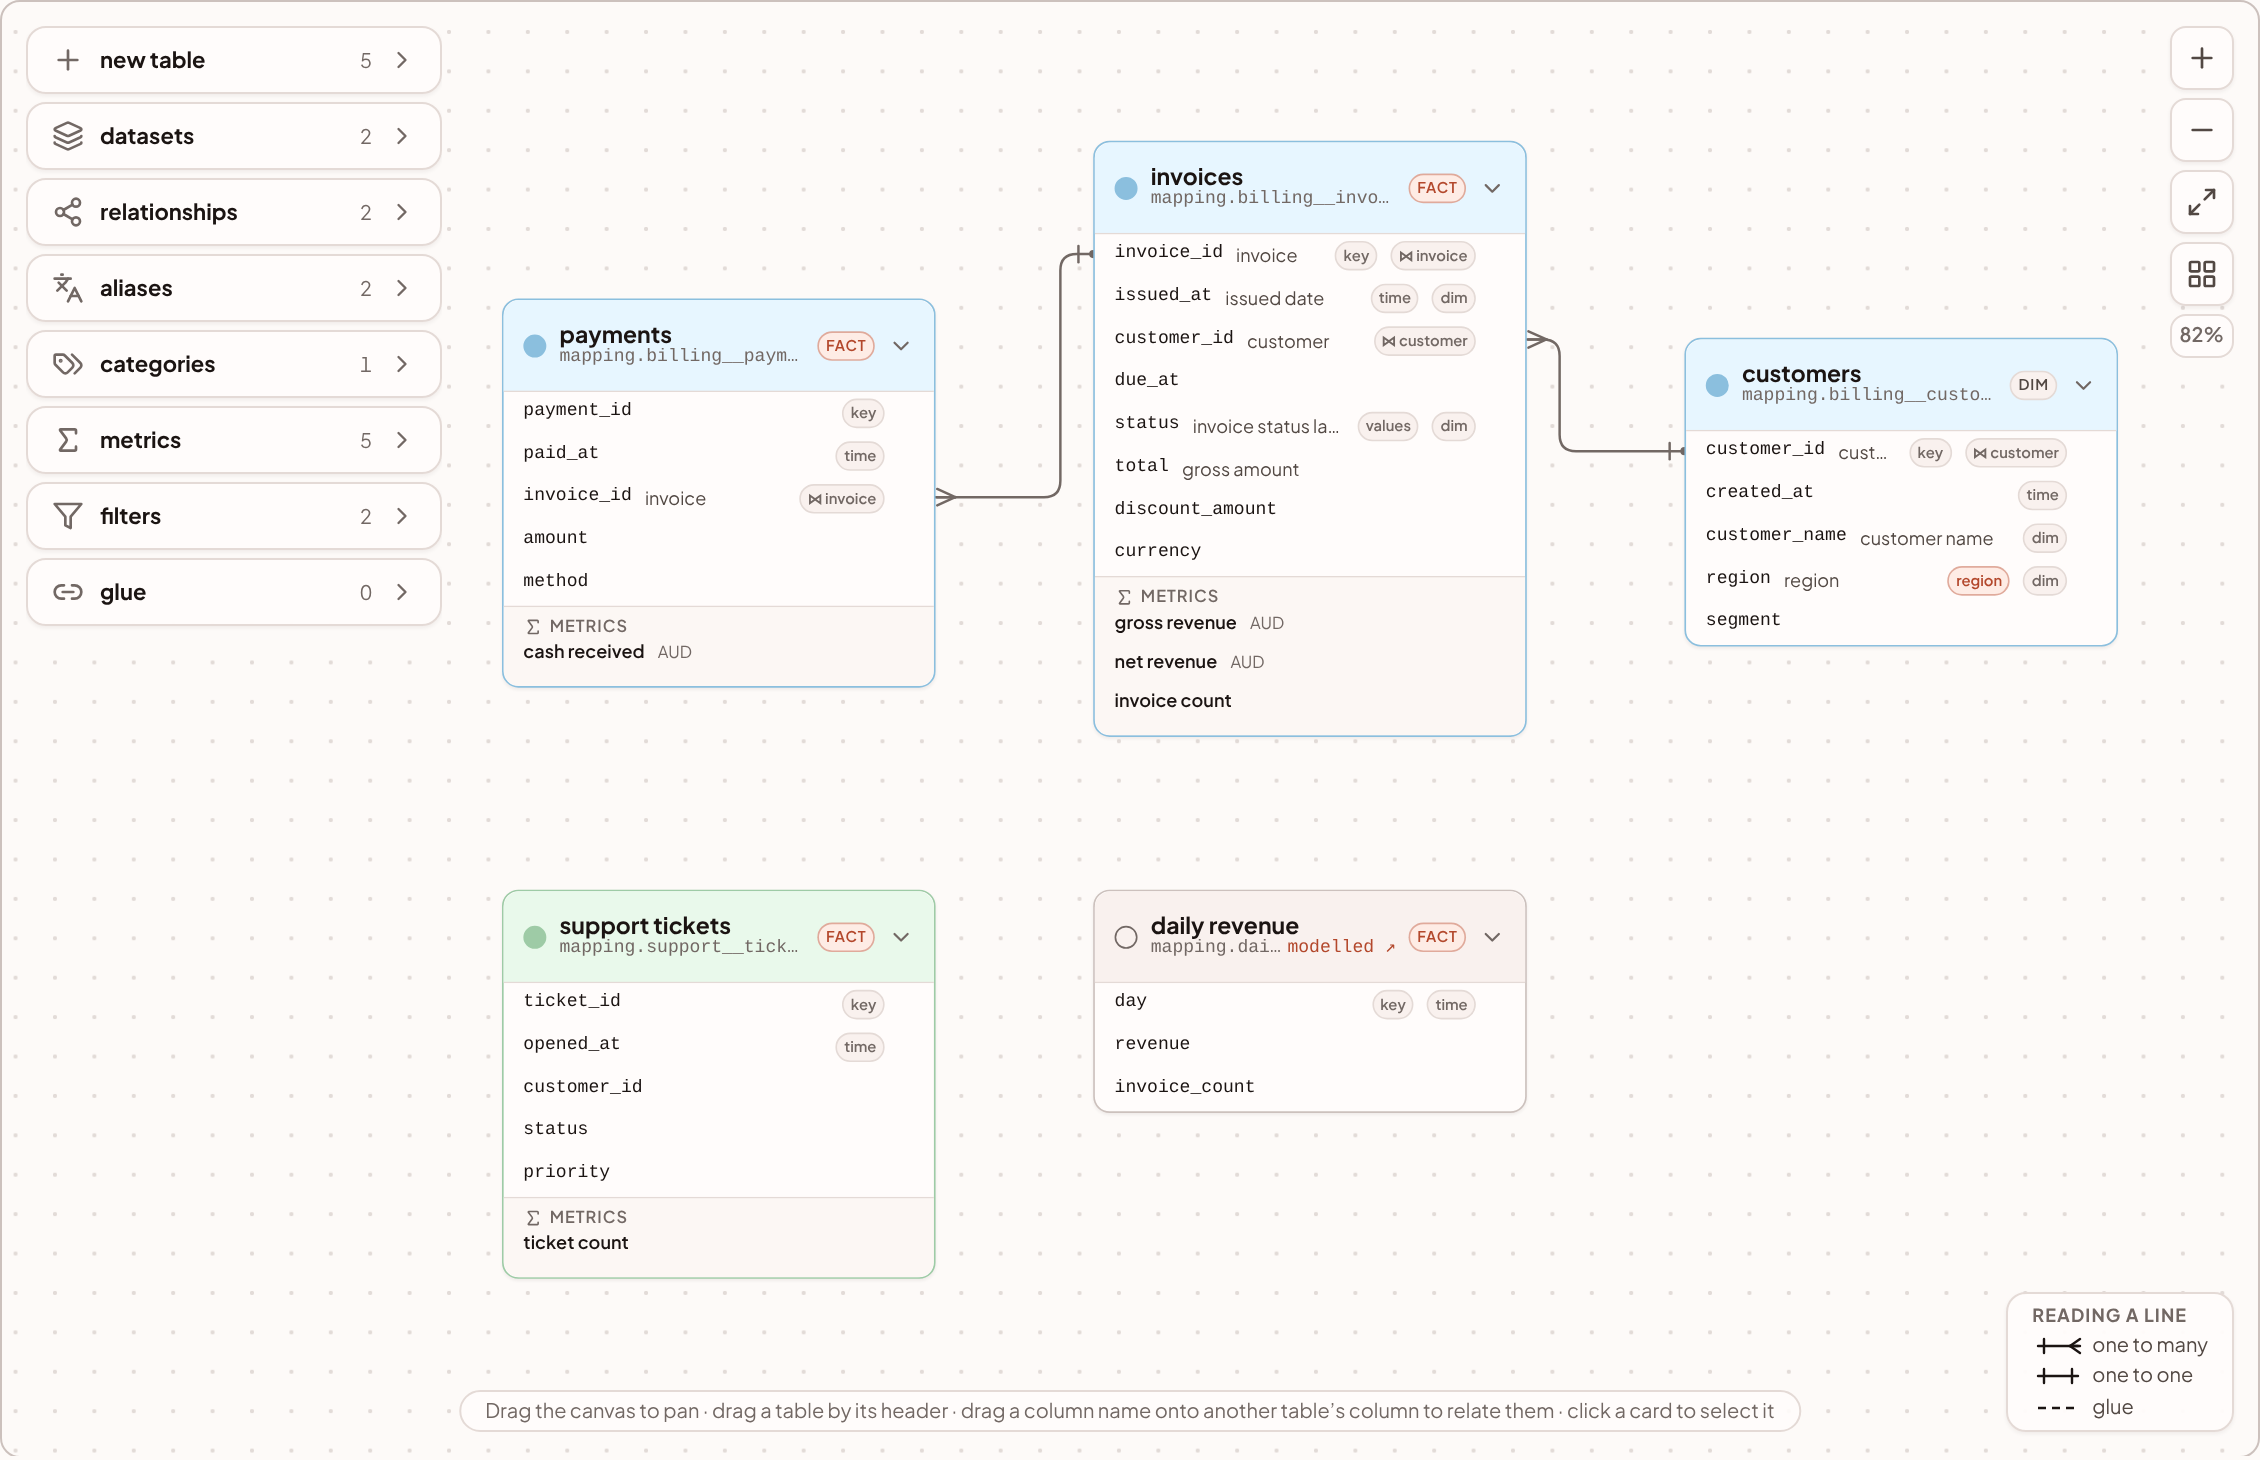
The whole workspace shares one map. When someone drags a card, everyone else opens the board with that card in its new place.
What is on the page
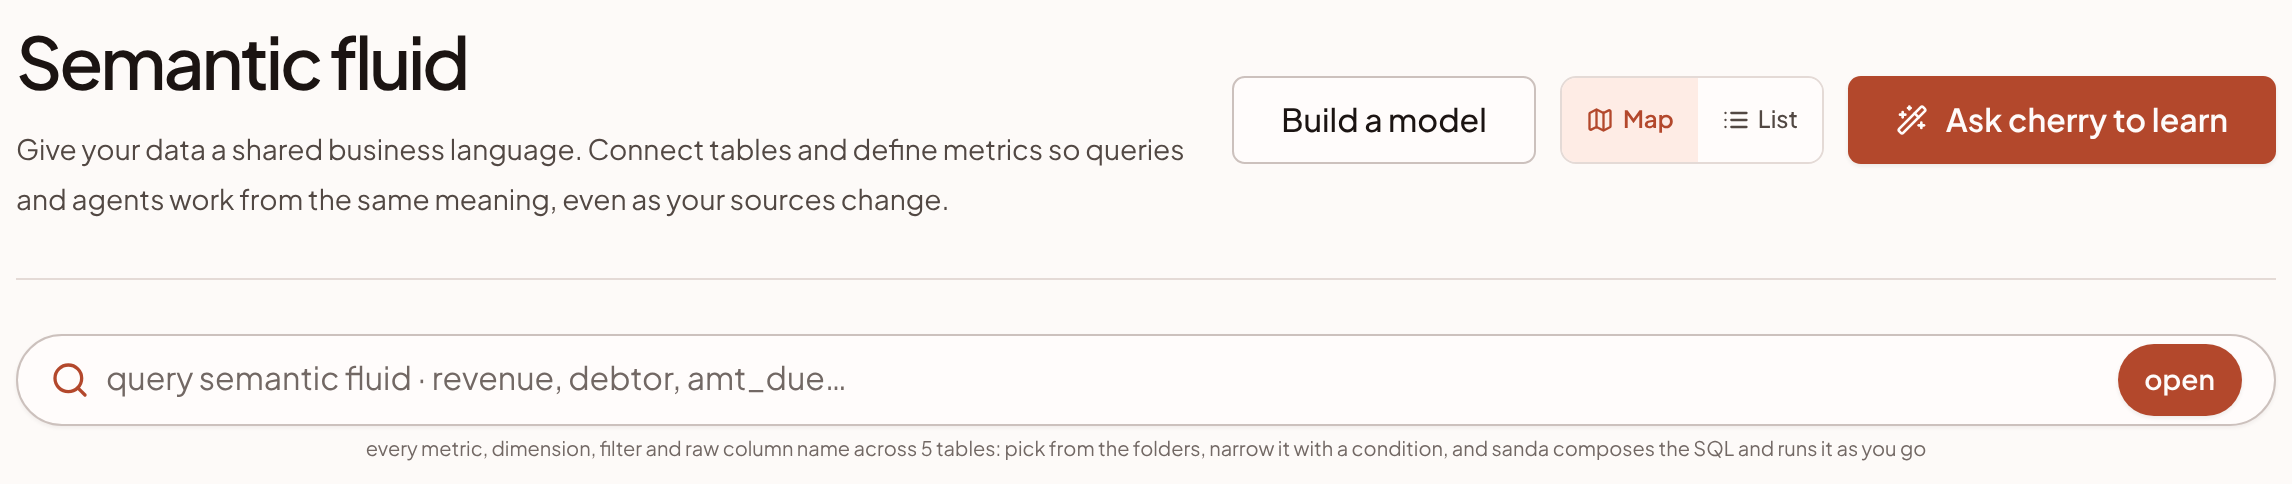
Above the map you have:
- Build a model. Takes you to Data · Modelling, where you build views that can then be put on the map.
- Map and List. Two views of the same fluid. The list is for precise edits the map does not offer. See the list view.
- Ask cherry to learn. Asks cherry to read your warehouse and propose a model. See Learn from my data.
- query semantic fluid. A bar with an open button that opens the workbench over the map. See Query the fluid.
On the map itself you have the rail on the left, the zoom controls on the right, and a legend at the bottom right once there is a line to read.
Reading a card
A card is one table.
- The header carries the table's name and its relation (for example
mapping.billing__invoices). The coloured dot on the left is the table's dataset. The fact or dim badge says whether sanda treats the table as something that happened or something that is. The chevron shows or hides the columns. - The columns list each column's name in code style. Key columns come first, then the event time, then the rest in table order. A card shows twelve columns and a +N more columns link for the rest.
- The tags beside a column say what the fluid knows about it: key, time, values (it has value labels), dim (a dimension is built on it) and
⋈ customer(it carries a relationship key). A category shows as a chip. - The metrics strip at the foot lists up to four metrics measured on the table, with their units.
- modelled appears under the name of a table that is a view you built yourself, not one a sync landed. Its link opens the view in Modelling.
If the map has five tables or fewer, every card opens with its columns showing. With more, cards start collapsed, showing a one-line summary of columns, metrics and grain.
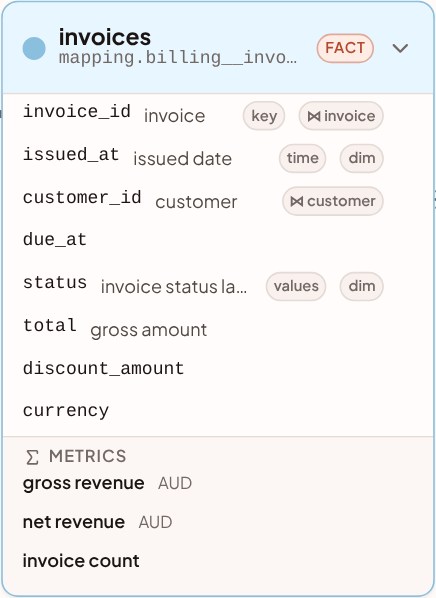
Hover over a column and a small tag icon appears. It opens a dialog where you give the column a name, other words people use for it, and any categories. See naming rules and dimensions and filters.
Move around
- Pan by dragging the empty canvas.
- Zoom with the plus and minus buttons. The map runs from 25% to 250%, and the current level shows beneath the buttons. The mouse wheel scrolls the page and does not zoom the map.
- Fit to content (the arrows button) frames every card.
Move a card
Drag a card by its header. A dashed outline shows where it will land: cards snap to a grid, and a card dropped on top of another is moved clear of it, so no table can be hidden under another. Drag to the edge of the map and it scrolls to follow you. The new position is saved for everyone.
Tidy the map
Once the map has more than one table, the four squares button, arrange by relationships, lays out every card by how the tables join. Tables that join others are placed from a hub outward: the fact table with the most joins sits in the middle, its neighbours to the left and right, and lookups (usually dimensions) on the outside. Tables that join nothing sit in a grid underneath, grouped by dataset.
It replaces your own arrangement, and only positions change. No table's kind, dataset or columns are touched. The same layout always comes out for the same fluid.
When there are joins to show and cards that have never been arranged, a tip appears beside the button: See how your tables join. Press the button, or dismiss the tip with its cross. The tip comes back when a learn pass adds new tables.
Select tables
- Click a card to select it. A ring shows the selection, and a strip at the foot of the map says what is selected.
- Hold Shift (or ⌘) and click to add a card to the selection or take it out.
- Click empty canvas, or press Escape, to clear it.
- Press Delete to take the selected tables off the map. sanda asks first, naming them, with remove and cancel. See taking a table off the map.
Escape undoes one layer at a time: a confirmation, then a dialog, then an open panel, then a selected line, then the card selection. Delete does nothing while you are typing in a field or while a panel is open.
Relate two tables
Drag from a column on one card onto a column on another. Columns whose types would join without a cast light up while you drag, and the others dim. Dropping opens a dialog to name the relationship and say which end holds one row. Click any line to see what it is and to unlink it. See relationships.
The rail
Each card on the rail opens a panel over the middle of the canvas, and the map behind it does not move. The rail stays above the panel, so you go from one panel to the next in one press.
| Card | Opens | Read more |
|---|---|---|
| suggestions | Everything sanda has proposed and is waiting on you. Shown only when something is waiting. | Review what sanda proposes |
| new table | The picker for adding tables from your warehouse | Tables and datasets |
| datasets | Groups of tables, and the colour each paints on the map | Tables and datasets |
| relationships | Every join, with which end holds one row | Relationships |
| aliases | What your team calls each table and column | Naming rules |
| categories | One word for a way of slicing, over many columns | Dimensions and filters |
| metrics | What your numbers mean | Metrics |
| filters | Named conditions | Dimensions and filters |
| glue | Joins between two source systems | Relationships |
Each card shows a count of what it holds. The counts for aliases, metrics and filters leave out suggestions, so a card never says you have eleven aliases when you have three and eight suggestions.
Every panel has a search box in the same place. Selecting a card on the map does not narrow a panel's list, so clicking a card to look at it never empties the panel you open next. Press Escape, the cross, or the shaded canvas to close a panel.
The list view
Press List for the same fluid as lists. There is a tab for each of mappings, metrics, dimensions, categories, filters and tables, each with an add form and a list of what exists. The pencil on a row opens the form on that row's current values, and typing a name that already exists fills the form in the same way, so saving corrects the row rather than blanking what you left empty. Use it for what the map does not offer: value labels, join keys typed by hand, dimensions and their roll-ups, and a table's grain, key and event time.
In the list view, the Add tables button opens the same picker as the new table card, and suggestions wait in a panel headed N waiting on you rather than on the rail.
An empty map
A workspace with nothing on its map says so. If a learn pass has left suggestions, the message counts them and offers review the suggestions. If nothing has been proposed, it offers add tables from my warehouse.
Keep going
Something unclear or out of date? Tell us, and we will fix the page.